
Updated: 03 Nov 2026
.
🤔 Seaborn คืออะไร?
seaborn เป็น package ยอดนิยมสำหรับสร้างกราฟ (data visualisation) ใน Python และมีจุดเด่น 3 ข้อ
- ใช้งานง่าย ด้วยการเขียนโค้ดที่ตรงไปตรงมา
- กราฟมีหน้าตาสวยงาม เหมาะสำหรับตีพิมพ์
- ทำงานร่วมกับ
pandasและmatplotlibซึ่งเป็น package ยอดนิยมสำหรับทำงานกับข้อมูล ได้อย่างลงตัว
💻 การเริ่มใช้งาน seaborn
เราเริ่มใช้งาน seaborn ได้ใน 2 ขั้นตอน:
- ติดตั้ง package
- โหลด package
ขั้นที่ 1. ติดตั้ง package:
ติดตั้ง seaborn รวมทั้ง pandas และ matplotlib ที่จะใช้งานร่วมกัน (ทำแค่ครั้งแรกครั้งเดียว)
! pip install seaborn pandas matplotlib
ขั้นที่ 2. โหลด package:
โหลด seaborn และ package ที่เกี่ยวข้อง (ทำทุกครั้งที่เริ่ม session ใหม่)
import seaborn as snsimport pandas as pdimport matplotlib.pyplot as plt
🧑💻 วิธีใช้งาน seaborn
seaborn มีวิธีสร้างกราฟดังนี้:
# Create a plotsns.plot(data, x, y, customisation)# Show the plotplt.show()
sns.plotกำหนดประเภทกราฟdataกำหนดชุดข้อมูลxกำหนดข้อมูลแกน xyกำหนดข้อมูลแกน ycustomisationตกแต่งกราฟplt.show()แสดงกราฟบนหน้าจอ
📉 การสร้างกราฟ 5 ประเภท
มาดูวิธีสร้างกราฟ 5 ประเภทใน seaborn กัน:
- Histogram
- Box plot
- Scatter plot
- Line plot
- Bar plot
.
🍔 ชุดข้อมูลตัวอย่าง
สำหรับชุดข้อมูลตัวอย่าง เราจะใช้ tips ซึ่งมีข้อมูลเกี่ยวกับทิปในร้านอาหารกัน
รายละเอียดชุดข้อมูล:
| คอลัมน์ | คำอธิบาย |
|---|---|
total_bill | ราคารวมค่าอาหาร |
tip | ทิปที่ได้รับ |
sex | เพศของลูกค้า |
smoker | การสูบบุหรี่ของลูกค้า (สูบ หรือ ไม่สูบ) |
day | วันของสัปดาห์ |
time | ช่วงเวลาของวัน (lunch หรือ dinner) |
size | จำนวนแขกในโต๊ะเดียวกัน |
วิธีโหลดข้อมูล:
tips = sns.load_dataset("tips")

.
📊 กราฟ 1. Histogram
Histogram เป็นกราฟแสดงการกระจายตัว (distribution) ของข้อมูล
ตัวอย่าง:
ดูการกระจายตัวของทิปที่พนักงานได้รับ
# Create a histogramsns.histplot( data = tips, x = "tip")# Show the plotplt.show()
ผลลัพธ์:

.
📊 กราฟ 2. Box Plot
Box plot แสดงการกระจายตัวของข้อมูล (เหมือนกับ histogram) และใช้เปรียบเทียบการกระจายตัวของตัวแปรหนึ่งระหว่างกลุ่มได้
ตัวอย่าง:
ดูการกระจายตัวของทิปในแต่ละมื้ออาหาร
# Create a box plotsns.boxplot( data = tips, x = "time", y = "tip")# Show the plotplt.show()
ผลลัพธ์:

.
📊 กราฟ 3. Scatter Plot
Scatter plot ใช้แสดงความสัมพันธ์ระหว่าง 2 ตัวแปร
ตัวอย่าง:
ความสัมพันธ์ระหว่างค่าอาหารและทิป
# Create a scatter plotsns.scatterplot( data = tips, x = "total_bill", y = "tip")# Show the plotplt.show()
ผลลัพธ์:

.
📊 กราฟ 4. Line Plot
Line plot ใช้แสดงความสัมพันธ์ระหว่างตัวแปร 2 ตัว หรือแสดงการเปลี่ยนแปลงของข้อมูลตามช่วงเวลา
ตัวอย่าง:
สำรวจทิปตามจำนวนแขก
# Create a line plotsns.lineplot( data = tips, x = "size", y = "tip")# Show the plotplt.show()
ผลลัพธ์:

.
📊 กราฟ 5. Bar Plot
Bar plot ใช้เปรียบเทียบค่าของตัวแปรระหว่างกลุ่ม
ตัวอย่าง:
สำรวจทิปในแต่ละวันของสัปดาห์
# Create a bar plotsns.barplot( data = tips, x = "day", y = "tip")# Show the plotplt.show()
ผลลัพธ์:

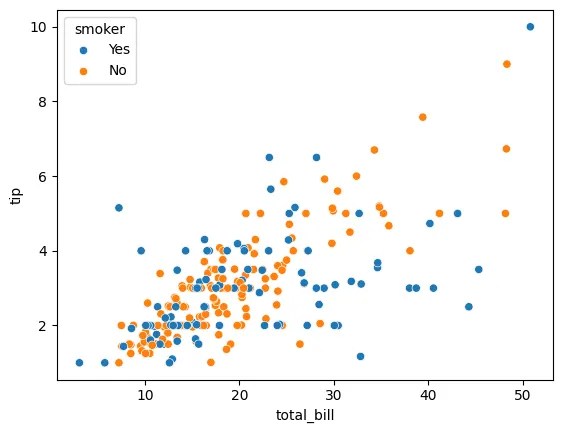
3️⃣ การเพิ่มตัวแปรที่ 3
เราสามารถเพิ่มตัวแปรที่ 3 (นอกเหนือจากแกน x, y) ได้โดยใช้สี (hue) ดังนี้
ตัวอย่าง:
เพิ่มประเภทการสูบบุหรี่ (ตัวแปรที่ 3) เข้าไปในกราฟความสัมพันธ์ระหว่างทิป (y) และค่าอาหาร (x)
# Create a scatter plotsns.scatterplot( data = tips, x = "total_bill", y = "tip", hue = "smoker" # third variable)# Show the plotplt.show()
ผลลัพธ์:
hue🎨 การตกแต่งกราฟ
เรามาดู 3 วิธีในการตกแต่งกราฟกัน:
- การเปลี่ยนสีข้อมูล
- การเปลี่ยนสไตล์กราฟ
- การเพิ่มข้อความ
.
🖌️ วิธีที่ 1. การเปลี่ยนสีข้อมูล
เปลี่ยนสีข้อมูล (hue) ได้ด้วย 2 วิธีย่อย:
- ใช้
palette: กำหนดสีเอง - ใช้
sns.set_palette(): ใช้เซตสีของseaborn
👉 ตัวอย่างการใช้ palette:
เปลี่ยนสีประเภทลูกค้าให้เป็นสีแดงและดำ
# Specify the colourscolours = { "Yes": "red", "No": "black"}# Create a scatter plotsns.scatterplot( data = tips, x = "total_bill", y = "tip", hue = "smoker", palette = colours # change colours)# Show the plotplt.show()
ผลลัพธ์:

palette👉 ตัวอย่างการใช้ sns.set_palette():
ใช้ชุดสีที่เหมาะกับผู้ชมที่ตาบอดสี
# Set the palettesns.set_palette("colorblind")# Create a scatter plotsns.scatterplot( data = tips, x = "total_bill", y = "tip", hue = "smoker")# Show the plotplt.show()
ผลลัพธ์:

sns.set_palette()ตัวอย่างเซตสีที่เลือกใช้ได้:
| Argument | ค่าสี |
|---|---|
"deep" | ค่าตั้งต้นของ seaborn |
"muted" | "deep" เวอร์ชันสีอ่อน |
"pastel" | สีพาสเทล |
"dark" | สีเข้ม |
"colorblind" | สีสำหรับคนตาบอดสี |
.
🖌️ วิธีที่ 2. การเปลี่ยนสไตล์กราฟ
เราเปลี่ยนสไตล์กราฟ (ธีม) ด้วย sns.set_style() ได้ดังนี้:
| Argument | สีพื้นหลัง | สีเส้นกราฟ |
|---|---|---|
"white" | ขาว ⚪ | ขาว ⚪ |
"dark" | ดำ ⚫ | ดำ ⚫ |
"whitegrid" | ขาว ⚪ | ดำ ⚫ |
"darkgrid" | ดำ ⚫ | ขาว ⚪ |
"ticks" | ขาว ⚪ | ไม่มี ✖️ |
ตัวอย่าง:
เปลี่ยนสไตล์กราฟให้มีฉากหลังสีเทา
# Set the stylesns.set_style("darkgrid")# Create a scatter plotsns.scatterplot( data = tips, x = "total_bill", y = "tip", hue = "smoker")# Show the plotplt.show()
ผลลัพธ์:

sns.set_style().
🖌️ วิธีที่ 3. การเพิ่มข้อความ
เราเพิ่มข้อความลงบนกราฟได้ด้วยคำสั่งจาก matplotlib.pyplot ดังนี้
ตัวอย่าง:
# Create a scatter plotsns.scatterplot( data = tips, x = "total_bill", y = "tip", hue = "smoker")# Add a titleplt.title("Total Bill vs Tip", fontsize = 16)# Add labelsplt.xlabel("Total Bill ($)", fontsize = 12)plt.ylabel("Tip ($)", fontsize = 12)# Show the plotplt.show()
ผลลัพธ์:

matplotlib.pyplot💪 สรุปเนื้อหา
ในบทความนี้ เราเรียนรู้วิธีการสร้างกราฟง่าย ๆ ใน seaborn กัน
การสร้างกราฟ 5 ประเภท:
| กราฟ | คำสั่ง |
|---|---|
| Histogram | sns.histplot() |
| Box plot | sns.boxplot() |
| Scatter plot | sns.scatterplot() |
| Line plot | sns.lineplot() |
| Bar plot | sns.barplot() |
การเพิ่มตัวแปรที่ 3:
| วิธี | คำสั่ง |
|---|---|
| เพิ่มผ่านสี | hue |
การตกแต่งกราฟ:
| ปรับแต่ง | คำสั่ง |
|---|---|
| สีข้อมูล | palette หรือ sns.set_palette() |
| สไตล์กราฟ | sns.set_style() |
| ข้อความ | plt.title() และ plt.xlabel() และ plt.ylabel() |

🫵 หลังจบบทความนี้
ลองมาใช้ seaborn เพื่อสร้างกราฟกันนะครับ
- ดูตัวอย่างโค้ดทั้งหมดในบทความที่ GitHub
- ดาวน์โหลดชุดข้อมูลสำหรับทดลองใช้
seaborn - อ่านคู่มือการใช้
seabornอย่างเป็นทางการ
Leave a Reply