Category: Data analytics

  • สรุป 5 keywords สำหรับ handle exceptions ใน Python: try, except, else, finally, raise — ตัวอย่างโค้ดการจ่ายเงินออนไลน์

    สรุป 5 keywords สำหรับ handle exceptions ใน Python: try, except, else, finally, raise — ตัวอย่างโค้ดการจ่ายเงินออนไลน์

    Exception หมายถึง error ที่เกิดขึ้นกับ code ที่มี syntax ถูกต้อง

    ยกตัวอย่างเช่น การหารเลขด้วย 0:

    print(5 / 0)
    

    ผลลัพธ์:

    ZeroDivisionError
    

    Exception สามารถทำให้ code หยุดทำงานหรือทำงานผิดพลาดได้

    ดังนั้น ในการเขียน code เราควรกำหนดวิธีในการจัดการกับ exception เพื่อป้องกันไม่ให้ code ทำงานผิดพลาด

    ใน Python เรามี 5 keywords สำหรับจัดการ exception ได้:

    1. try
    2. except
    3. else
    4. finally
    5. raise

    เราไปดูตัวอย่างการใช้งานทั้ง 5 keywords ผ่านตัวอย่าง code การจ่ายเงินออนไลน์กัน


    🔨 try, except

    try และ except เป็น keywords ที่ใช้ร่วมกัน โดยใน try เราจะใส่ code ที่เราคิดว่าอาจจะเกิด exception ขึ้นได้

    ส่วนใน except เราจะใส่สิ่งที่เราต้องการให้เกิดขึ้นเมื่อเกิด exception ขึ้น

    ยกตัวอย่างเช่น เราเขียน code เพื่อเช็กว่า payment มีค่ามากกว่า 0 หรือไม่ แต่ payment ที่ใส่เข้ามาอาจไม่ใช่ตัวเลข ซึ่งจะทำให้ code ของเราหยุดทำงาน:

    # Without try, except
    
    # Set payment
    payment = "one thousand"
    
    # Validate payment
    if float(payment) < 0:
        print("Payment cannot be negative.")
    

    ผลลัพธ์:

    ValueError
    

    เราสามารถใช้ try และ except ช่วยให้ code ทำงานต่อได้ พร้อมทำให้บอกเราให้รู้ว่า เกิดข้อผิดพลาดอะไรขึ้น:

    # Set payment
    payment = "one thousand"
    
    # Code that may raise exception
    try:
        if float(payment) < 0:
            print("Payment cannot be negative.")
    
    # Print when exception occurs
    except ValueError:
        print("Payment must be a number.")


    ผลลัพธ์:

    Payment must be a number.
    

    🤔 else

    else ทำงานคล้าย except แต่แทนที่จะส่งค่าบางอย่างกลับมาเมื่อเกิด exception, else จะทำงานเมื่อไม่มี exception เกิดขึ้นใน try

    ยกตัวอย่างเช่น ใช้ else เพื่อแสดงข้อความว่ากำลังประมวลผล เมื่อ payment เป็นตัวเลข:

    # Set payment
    payment = 500
    
    # Code that may raise exception
    try:
        if float(payment) < 0:
            print("Payment cannot be negative.")
    
    # Print when exception occurs
    except ValueError as e:
        print(f"Error: {e}")
    
    # Print when exception does not occur
    else:
        print("Processing payment ...")
    

    ผลลัพธ์:

    Processing payment ...
    

    ☝️ finally

    finally จะส่งค่ากลับมาไม่ว่าจะเกิด exception ขึ้นหรือไม่ก็ตาม

    ยกตัวอย่างเช่น ใช้ finally แสดงข้อความขอบคุณลูกค้า ไม่ว่า payment จะผ่านหรือไม่ก็ตาม:

    # Set payment
    payment = 500
    
    # Code that may raise exception
    try:
        if float(payment) < 0:
            print("Payment cannot be negative.")
    
    # Print when exception occurs
    except ValueError as e:
        print(f"Error: {e}")
    
    # Print when exception does not occur
    else:
        print("Processing payment ...")
    
    # Print no matter what
    finally:
        print("Thank you for your payment.")
    

    ผลลัพธ์:

    Processing payment ...
    Thank you for your payment.
    

    👋 raise

    สุดท้าย เราจะใช้ raise กำหนด exception ได้เอง

    ยกตัวอย่างเช่น ใช้ raise เพื่อแจ้งเตือนเมื่อ payment ติดลบ:

    # Set payment
    payment = -50
    
    # Code that may raise exception
    try:
        if not isinstance(payment, (int, float)):
            raise TypeError("Payment must be a number.")
        if payment < 0:
            raise ValueError("Payment cannot be negative.")
    
    # Print when exception occurs
    except (TypeError, ValueError) as e:
        print(f"Error: {e}")
    
    # Print when exception does not occur
    else:
        print("Processing payment ...")
    
    # Print no matter what
    finally:
        print("Thank you for your payment.")
    

    ผลลัพธ์:

    Error: Payment cannot be negative.
    Thank you for your payment.
    

    💪 สรุป 5 Keywords

    ในบทความนี้ เราได้เรียนรู้วิธีใช้ 5 keywords เพื่อจัดการ exception ใน Python ได้แก่:

    1. try: รัน code ที่เราคิดว่าอาจเกิด exception
    2. except: code ที่จะรันเมื่อเกิด exception จาก try
    3. else: code ที่รันเมื่อไม่เกิด exception จาก try
    4. finally: code ที่จะรันไม่ว่า try จะเกิด exception หรือไม่
    5. raise: code สำหรับแสดง exception ที่กำหนดเอง

    ตัวอย่าง code:

    # Set payments
    payments = {
        "Alex": "one thousand",
        "Barbara": -50,
        "Carter": 500
    }
    
    # Loop through payments
    for name, payment in payments.items():
        
        # Print name and payment
        print(f"{name} paying {payment}.")
        
        # Code that may raise exception
        try:
            if not isinstance(payment, (int, float)):
                raise TypeError("Payment must be a number.")
            if payment < 0:
                raise ValueError("Payment cannot be negative.")
    
        # Print when exception occurs
        except (TypeError, ValueError) as e:
            print(f"Error: {e}")
    
        # Print when exception does not occur
        else:
            print("Processing payment ...")
    
        # Print no matter what
        finally:
            print("Thank you for your payment.")
            
        # Print divider
        print("\\n -------------------------------------------------- \\n")
    

    ผลลัพธ์:

    Alex paying one thousand.
    Error: Payment must be a number.
    Thank you for your payment.
    
     -------------------------------------------------- 
    
    Barbara paying -50.
    Error: Payment cannot be negative.
    Thank you for your payment.
    
     -------------------------------------------------- 
    
    Carter paying 500.
    Processing payment ...
    Thank you for your payment.
    
     -------------------------------------------------- 


    📚 Further Reading: Python Exceptions

    ศึกษาประเภทของ exception ใน Python ได้ที่: Python Built-in Exceptions


    😺 GitHub

    ดู code ทั้งหมดในบทความนี้ได้ที่ GitHub


    📃 References

  • Function in R: ความหมาย, ส่วนประกอบ, และประเภท function ในภาษา R สำหรับผู้เริ่มต้น พร้อมตัวอย่าง

    Function in R: ความหมาย, ส่วนประกอบ, และประเภท function ในภาษา R สำหรับผู้เริ่มต้น พร้อมตัวอย่าง

    Function เป็น 1 ใน 2 องค์ประกอบหลักในภาษา R เคียงข้างกับ object

    ในขณะที่ object คือ สิ่งที่มีอยู่ในภาษา R, function คือ สิ่งที่เกิดขึ้นในภาษา R

    ภาษา R จะทำงานไม่ได้ ถ้าขาดทั้ง 2 อย่างไป

    ในบทความนี้ เราจะมีวิธีใช้งาน function ในภาษา R กัน:

    1. Function คืออะไร?
    2. ส่วนประกอบของ function
    3. ประเภทของ function
    4. การดูรายละเอียดของ function

    ถ้าพร้อมแล้ว ไปเริ่มกันเลย


    🤔 What Is a Function?

    Function คือ code ที่เราเรียกใช้งานซ้ำ ๆ ได้ ซึ่งช่วยให้เราเขียน code ได้ง่ายขึ้น

    เช่น แทนที่เราจะหาผลรวมของ 1–5 โดยพิมพ์ตัวเลขทีละตัว:

    1 + 2 + 3 + 4 + 5
    

    เราสามารถใช้ function ช่วยได้แบบนี้:

    sum(1:5)
    

    และถ้าเราต้องการหาผลลัพธ์ของเลขชุดอื่น (เช่น 15–20) เราสามารถใช้ function เดียวกันได้:

    sum(15:20)
    

    จะเห็นได้ว่า function ทำให้เราเขียน code ได้ง่ายและสะดวกขึ้นมาก


    🧠 Anatomy of Function

    Function ประกอบด้วย 2 ส่วน:

    1. Name หรือ ชื่อของ function (เช่น round)
    2. Argument หรือ input สำหรับ function (เช่น 1:5 และ 15:20)

    โดย argument แบ่งได้เป็น 2 ประเภท:

    1. Positional argument หรือ input ตามตำแหน่งใน function
    2. Keyword argument หรือ input ตาม keywords

    ยกตัวอย่าง เช่น sample() ซึ่งเป็น function สุ่มตัวอย่าง และมี 2 arguments:

    1. ชุดข้อมูล (เช่น 1:10)
    2. จำนวนที่ต้องการสุ่ม (เช่น 3)

    เราสามารถเขียนแบบ positional และ keyword argument ได้แบบนี้:

    # Positional arguments
    sample(1:10, 3)
    
    # Keyword arguments
    sample(x = 1:10, size = 3)
    

    จากตัวอย่าง จะเห็นว่า positional argument เขียนง่ายกว่า แต่ keyword argument ช่วยให้อ่าน code ได้ง่ายกว่า

    เราควรใช้ positional argument เมื่อใช้ function ที่ไม่ซับซ้อน เช่น sum() ที่ต้องการแค่ 1 argument

    และควรใช้ keyword argument กับ function ที่มีหลาย arguments


    🗃️ Types of Functions

    Function แบ่งได้เป็น 3 ประเภท ได้แก่:

    1. Base R function
    2. Package function
    3. Custom function

    .

    📦 Base R Function

    Base R function เป็น function ที่มาพร้อมกับภาษา R และเรียกใช้งานได้โดยไม่ต้องติดตั้ง package เพิ่มเติม เช่น:

    • mean()
    • sum()
    • length()
    • round()
    • seq()

    .

    📥 Package Function

    Package function เป็น function ที่คนอื่นสร้างไว้และเราสามารถโหลดมาใช้ได้

    ในการเรียกใช้งาน เราจะต้องทำ 2 อย่างก่อน:

    1. ติดตั้ง package ด้วย install.packages() (ทำครั้งแรกครั้งเดียว)
    2. โหลด package ทุกครั้งที่เริ่มต้น session ด้วย library()

    ถ้าข้าม 2 ขั้นตอนนี้ไป เราจะไม่สามารถใช้งาน function ได้

    เช่น เรียกใช้ sample_n() เพื่อสุ่มข้อมูลจาก data frame (ตารางข้อมูล):

    # Data frame of my friends
    friends <- data.frame(
      name = c("Alice", "Bob", "Charlie", "David", "Eve", "Frank", "Grace", "Heidi"),
      age = c(28, 32, 25, 30, 29, 35, 27, 31)
    )
    
    # friends data frame:
    #       name age
    #  1   Alice  28
    #  2     Bob  32
    #  3 Charlie  25
    #  4   David  30
    #  5     Eve  29
    #  6   Frank  35
    #  7   Grace  27
    #  8   Heidi  31
    
    # Sample 3 of my friends
    sample_n(friends, 3)
    

    ผลลัพธ์:

    Error in sample_n(friends, 3) : could not find function "sample_n"
    

    จะเห็นได้ว่า R ส่ง error กลับมา ซึ่งเราแก้ได้โดยติดตั้งและโหลด package ก่อนเรียกใช้งาน sample_n():

    # Install package
    install.packages("dplyr")
    
    # Load package
    library(dplyr)
    

    ซึ่งจะทำให้เราใช้งาน function ได้สำเร็จ:

    # Sample 3 of my friends
    sample_n(friends, 3)
    

    ผลลัพธ์:

       name age
    1   Bob  32
    2 Heidi  31
    3 Grace  27
    

    .

    🎁 Custom Function

    Custom function เป็น function ที่เราเขียนขึ้นเอง เพื่อตอบโจทย์ที่ function อื่นไม่สามารถทำได้

    เราสามารถสร้าง custom function ได้ด้วย function() {} เช่น สร้าง function เพื่อคำนวณพื้นที่วงกลม:

    # Custome function to find circle area
    circle_area <- function(radius) {
    
    	# Calculate area
      area <- pi * (radius^2)
      
      # Return area
      print(area)
    }
    

    ในตัวอย่าง function จะคำนวณพื้นที่วงกลมโดยใช้ 1 argument 1 คือ radius และ print ค่าใน console

    หลังจากสร้าง function แล้ว เราสามารถเรียกใช้งาน function ได้เหมือน function อื่น ๆ:

    # Calculate circle area where radius is 14
    circle_area(14)
    

    ผลลัพธ์:

    [1] 615.7522
    

    ❓ Get Help

    สุดท้าย เราสามารถดูรายละเอียดของ function ได้ 2 วิธี:

    1. ?: ดูคู่มือการใช้ function
    2. args(): ดู argument ของ function

    เช่น ดูคู่มือของ round() ซึ่งเป็น function สำหรับปัดจุดทศนิยม:

    # Read round() documentation
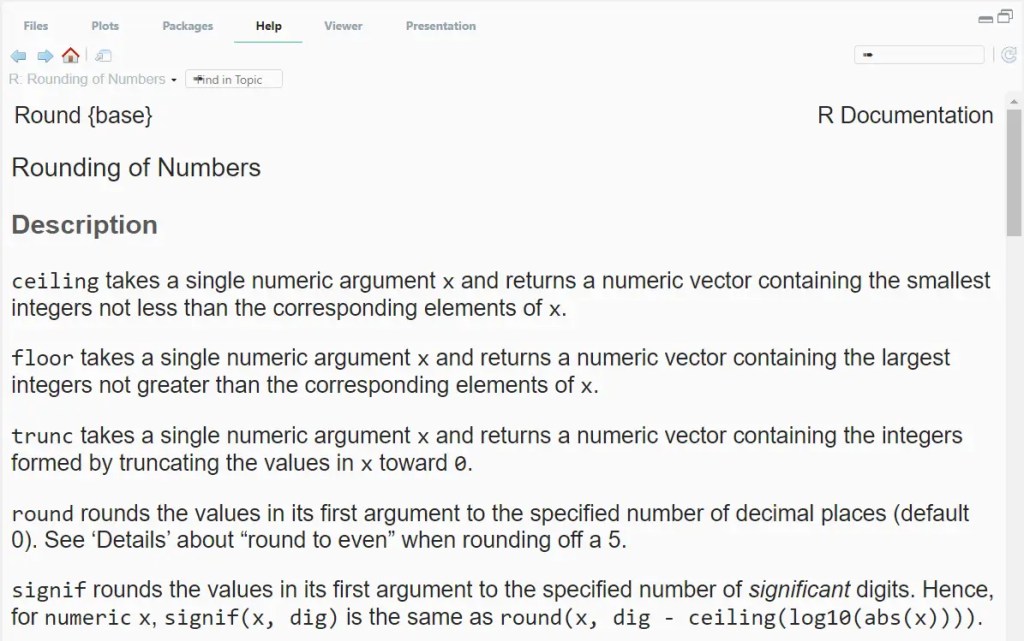
    ?round
    

    เราจะเห็นคู่มือการใช้งาน round() ในหน้าต่างของเรา:

    หรือดู arguments ของ round():

    # Learn about round() arguments
    args(round)
    

    ผลลัพธ์:

    function (x, digits = 0, ...) 
    NULL
    

    💪 Summary

    ในบทความนี้ เราได้ทำความรู้จักกับ function ซึ่งเป็น 1 ใน 2 องค์ประกอบที่สำคัญในภาษา R กัน:

    1. Function คือ code ที่สามารถเรียกใช้งานซ้ำได้
    2. Function ประกอบด้วย 2 ส่วน: name และ argument
    3. Argument มี 2 ประเภท: positional และ keyword argument
    4. Function มี 3 ประเภท:
      1. Base R function ที่มาพร้อมภาษา R
      2. Package function ที่มากับ packages
      3. Custom function ที่เราสร้างเอง
    5. ดูรายละเอียดของ function ได้ด้วย ? และ args()

    😺 GitHub

    ดูตัวอย่าง code ทั้งหมดในบทความได้ที่ GitHub


    📃 References


    ✅ R Book for Psychologists: หนังสือภาษา R สำหรับนักจิตวิทยา

    📕 ขอฝากหนังสือเล่มแรกในชีวิตด้วยนะครับ 😆

    🙋 ใครที่กำลังเรียนจิตวิทยาหรือทำงานสายจิตวิทยา และเบื่อที่ต้องใช้ software ราคาแพงอย่าง SPSS และ Excel เพื่อทำข้อมูล

    💪 ผมขอแนะนำ R Book for Psychologists หนังสือสอนใช้ภาษา R เพื่อการวิเคราะห์ข้อมูลทางจิตวิทยา ที่เขียนมาเพื่อนักจิตวิทยาที่ไม่เคยมีประสบการณ์เขียน code มาก่อน

    ในหนังสือ เราจะปูพื้นฐานภาษา R และพาไปดูวิธีวิเคราะห์สถิติที่ใช้บ่อยกัน เช่น:

    • Correlation
    • t-tests
    • ANOVA
    • Reliability
    • Factor analysis

    🚀 เมื่ออ่านและทำตามตัวอย่างใน R Book for Psychologists ทุกคนจะไม่ต้องพึง SPSS และ Excel ในการทำงานอีกต่อไป และสามารถวิเคราะห์ข้อมูลด้วยตัวเองได้ด้วยความมั่นใจ

    แล้วทุกคนจะแปลกใจว่า ทำไมภาษา R ง่ายขนาดนี้ 🙂‍↕️

    👉 สนใจดูรายละเอียดหนังสือได้ที่ meb:

  • วิธีใช้ polars: package ทรงพลังสำหรับทำงานกับ tabular data ใน Python — ตัวอย่างการทำงานกับ IKEA Products dataset

    วิธีใช้ polars: package ทรงพลังสำหรับทำงานกับ tabular data ใน Python — ตัวอย่างการทำงานกับ IKEA Products dataset

    polars เป็น package สำหรับทำงานกับข้อมูลในรูปแบบตาราง (tabular data) ใน Python และถูกพัฒนาด้วย Rust และ Apache Arrow ซึ่งทำให้ polars ประมวลผลได้เร็วและมีประสิทธิภาพสูง

    polars เป็นทางเลือกสำหรับคนที่เบื่อกับข้อจำกัดของ pandas ซึ่งเป็น package ยอดนิยมสำหรับทำงานกับข้อมูลในรูปแบบตาราง โดย polars ได้เปรียบ pandas อยู่ 3 อย่าง:

    1. Fast: ประมวลผลเร็วกว่า
    2. Intuitive: มี syntax ที่ใช้ง่ายกว่า
    3. Lazy: รองรับการเขียนแบบ lazy evaluation (ดูรายละเอียดเพิ่มเติมด้านล่าง) ทำให้ประมวลผลได้มีประสิทธิภาพมากกว่า

    Note: ดูวิธีการใช้ pandas ได้ที่บทความนี้

    Source: https://pola.rs/

    ในบทความนี้ เราจะมาดูวิธีใช้ polars ผ่านตัวอย่างการทำงานกับ IKEA Products dataset ที่มีข้อมูลเฟอร์นิเจอร์จาก IKEA กัน

    โดยบทความแบ่งเป็น 9 ส่วนดังนี้:

    1. Import package and dataset: โหลด package และ dataset
    2. Explore: สำรวจ dataset ก่อนทำงานกับข้อมูล
    3. Select: เลือกข้อมูล
    4. Filter: กรองข้อมูล
    5. Sort: จัดเรียงข้อมูล
    6. Aggregate: หาค่าทางสถิติ
    7. Mutate: เพิ่ม ลบ แก้ไข column
    8. Lazy: การทำงานแบบ lazy
    9. Chaining: การเชื่อมต่อ function

    ถ้าพร้อมแล้ว ไปเริ่มกันเลย


    📦 Section 1. Import Package & Dataset

    ในขั้นแรก เราจะโหลด package และ dataset ที่จะใช้งานกันก่อน

    เราจะโหลด package ด้วย import แบบนี้:

    import polars as pl
    

    Note: ก่อนโหลด เราจะต้องติดตั้ง package ซึ่งเราสามารถทำได้ด้วย pip install

    และโหลด dataset ด้วย read_csv() เพราะข้อมูลเป็นไฟล์ CSV:

    df = pl.read_csv("ikea_products.csv")
    

    ตอนนี้ เรามีข้อมูลพร้อมจะทำงานต่อแล้ว


    🧭 Section 2. Explore

    ในขั้นที่ 2 เราจะสำรวจข้อมูลที่เพิ่งโหลดเสร็จ ซึ่งเราทำได้ 5 วิธี:

    1. shape
    2. schema
    3. head()
    4. glimpse()
    5. describe()

    .

    🔷 2.1 shape

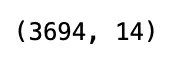
    shape เป็น attribute สำหรับเช็กจำนวน rows และ columns ใน dataset:

    df.shape
    

    ผลลัพธ์:

    จากผลลัพธ์ จะเห็นว่า dataset มีข้อมูล 3,694 rows และมี 14 columns

    .

    🗺️ 2.2 schema

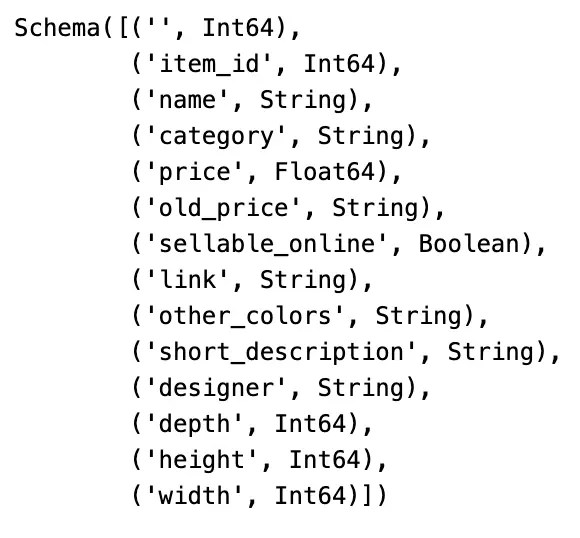
    schema เป็น attribute สำหรับแสดงชื่อและประเภทข้อมูลของ columns:

    df.schema
    

    ผลลัพธ์:

    .

    🐵 2.3 head()

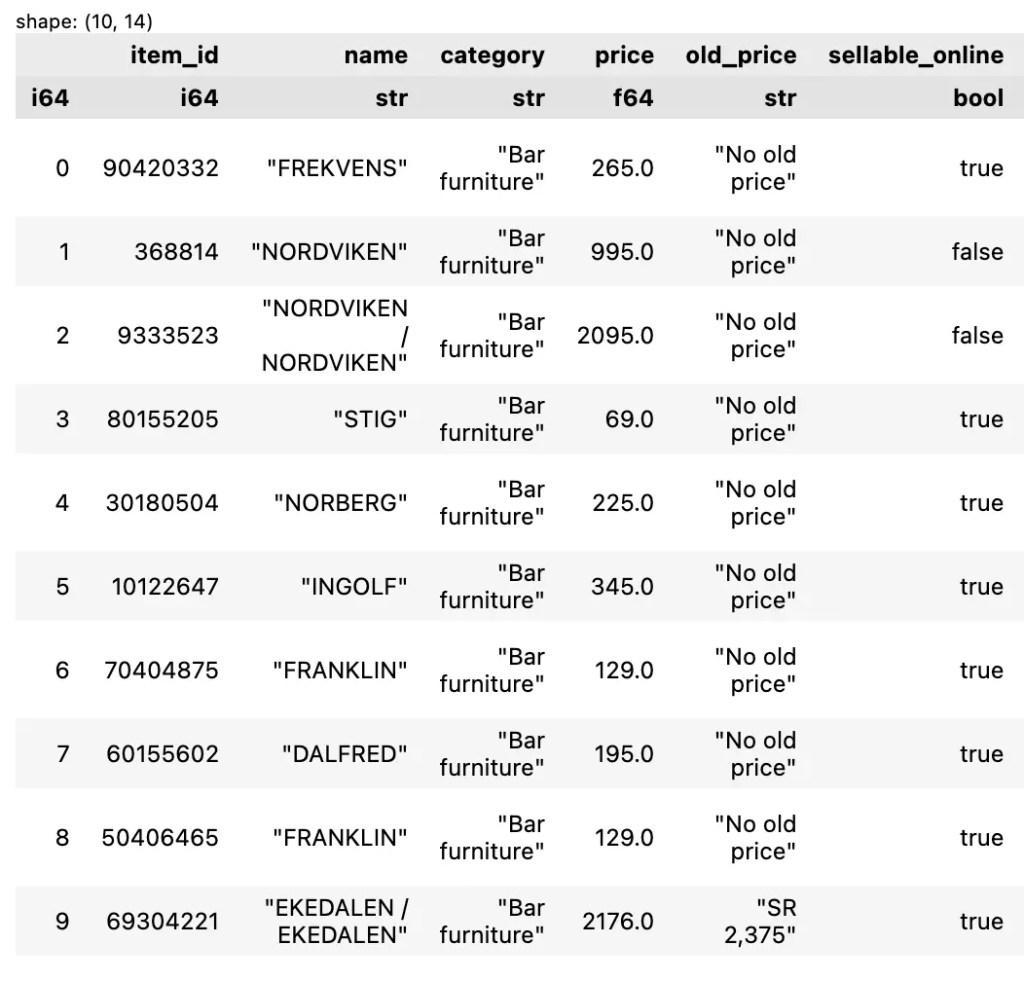
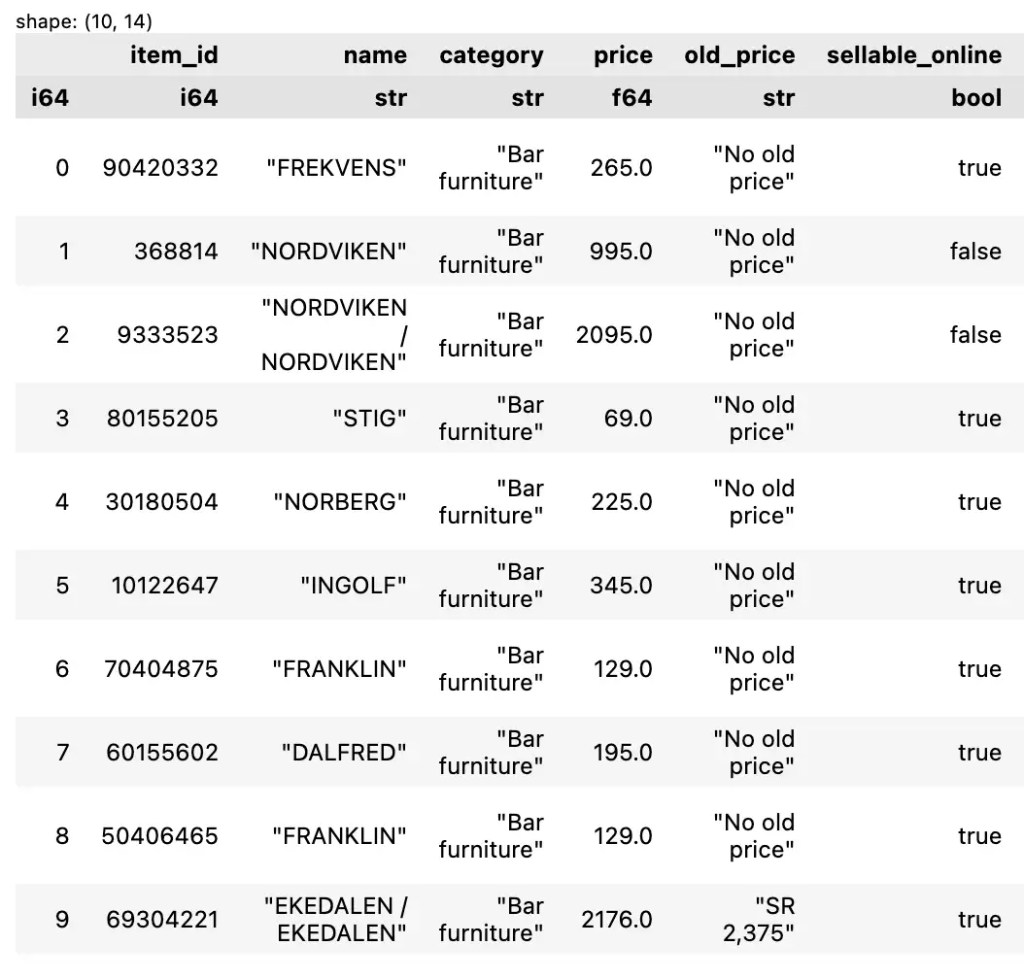
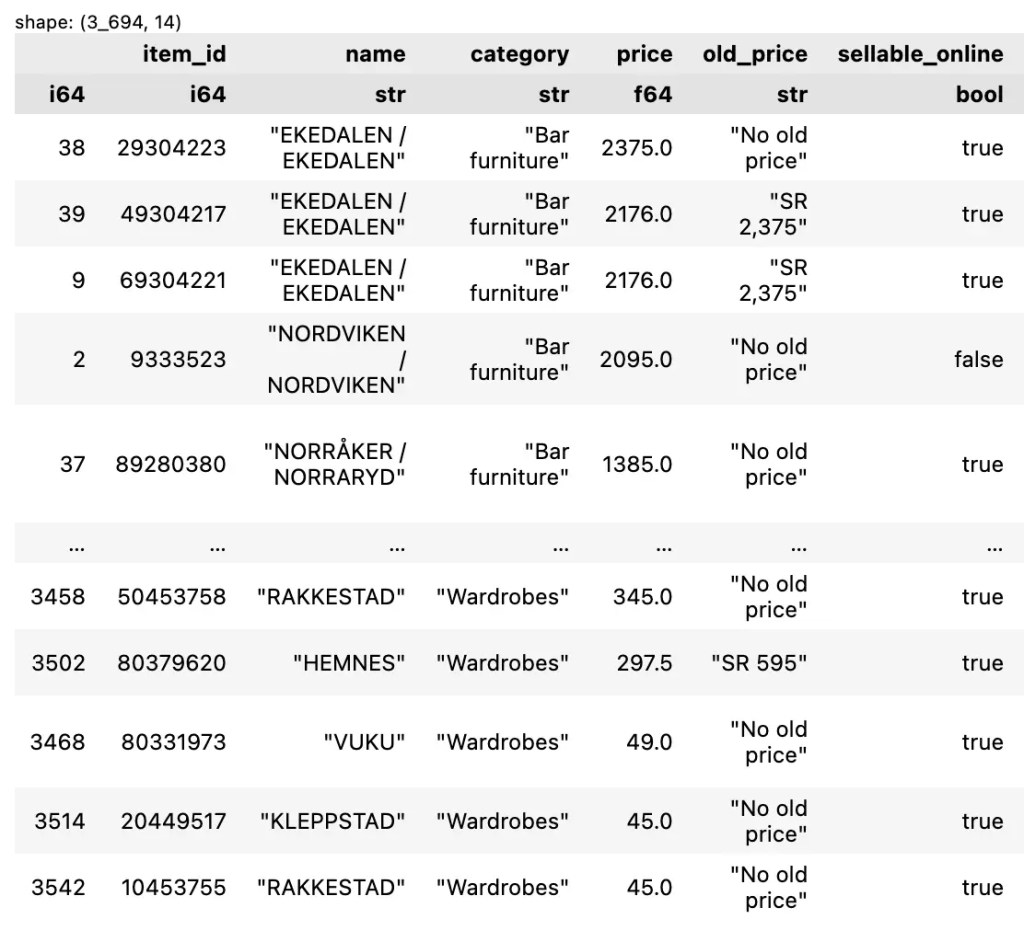
    head() เป็น method สำหรับดู n rows แรกของข้อมูล เช่น ดู 10 แรกของข้อมูล:

    df.head(10)
    

    ตัวอย่างผลลัพธ์:

    .

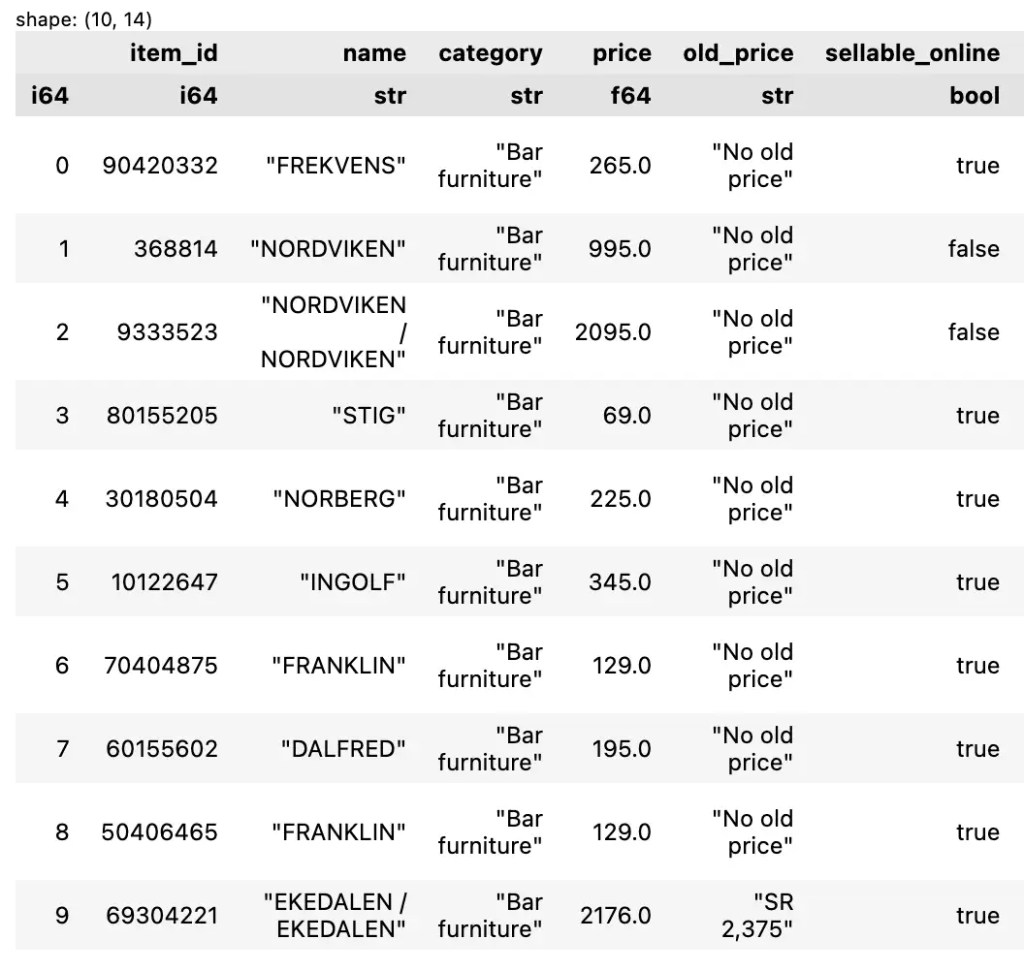
    🔎 2.4 glimpse()

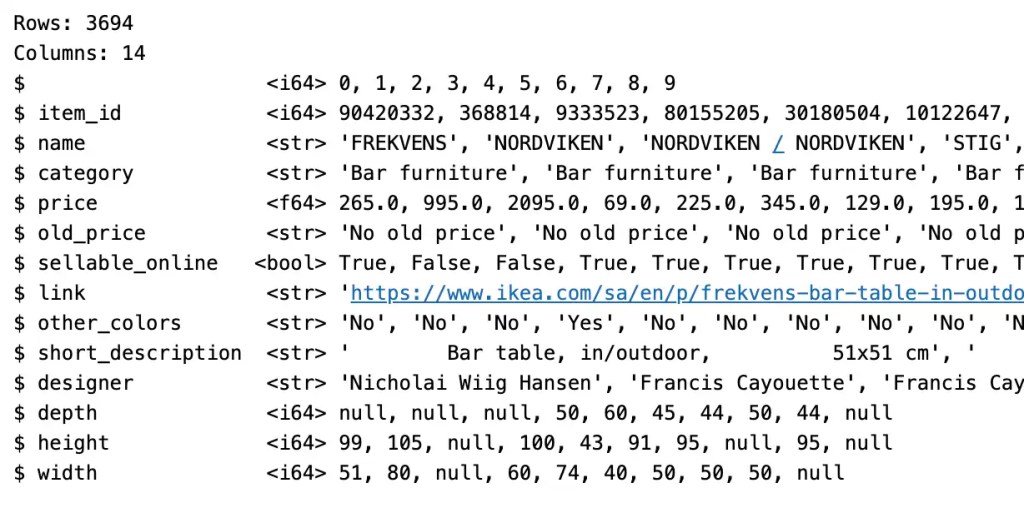
    glimpse() เป็น method สำหรับดูโครงสร้างข้อมูล ซึ่งประกอบด้วย:

    1. จำนวน rows และ columns
    2. ชื่อ column
    3. ประเภทข้อมูล
    4. ตัวอย่างข้อมูล
    df.glimpse()
    

    ตัวอย่างผลลัพธ์:

    .

    .

    📝 2.5 describe()

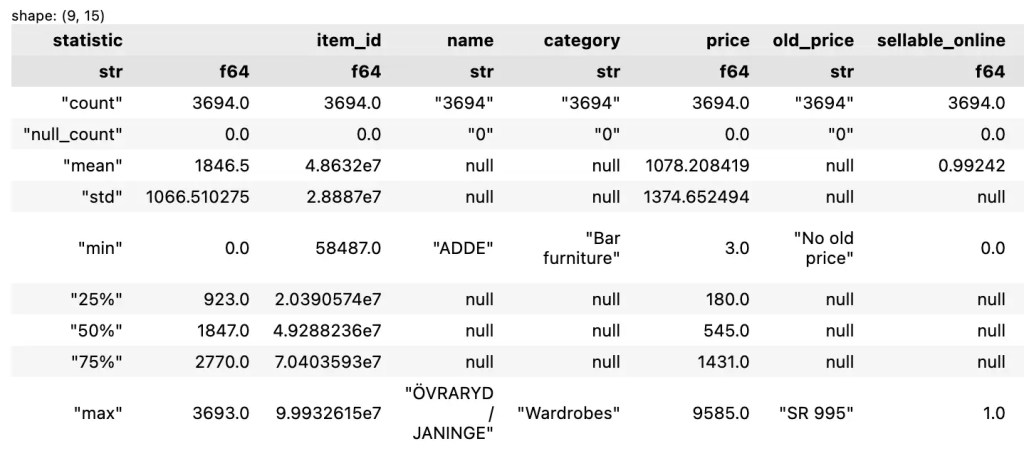
    describe() เป็น method สำหรับแสดง summary statistics ของ columns:

    1. count: จำนวนข้อมูล
    2. null_count: จำนวนข้อมูลที่เป็นค่าว่าง
    3. mean: ค่าเฉลี่ย
    4. std: ค่าเบี่ยงเบนมาตรฐาน (standard deviation)
    5. min: ค่าต่ำสุด
    6. 25%, 50%, 75%: ข้อมูลที่ quartile ที่ 1, 2, และ 3
    7. max: ค่าสูงสุด
    df.describe()
    

    ตัวอย่างผลลัพธ์:


    🫳 Section 3. Select

    เรามี 2 วิธีในการเลือก rows และ columns จากข้อมูล:

    1. ใช้ []
    2. ใช้ slice() และ select()

    .

    🔲 3.1 Using []

    เราจะใช้ [] โดยกำหนด rows และ columns ที่ต้องการแบบนี้:

    df[rows, cols]
    

    ถ้าเราต้องการ rows หรือ columns ทั้งหมด ให้เราเว้นข้อมูลส่วนนั้นไว้ เช่น เลือกข้อมูล 10 rows แรก และ columns ทั้งหมด:

    df[:10]
    

    ตัวอย่างผลลัพธ์:

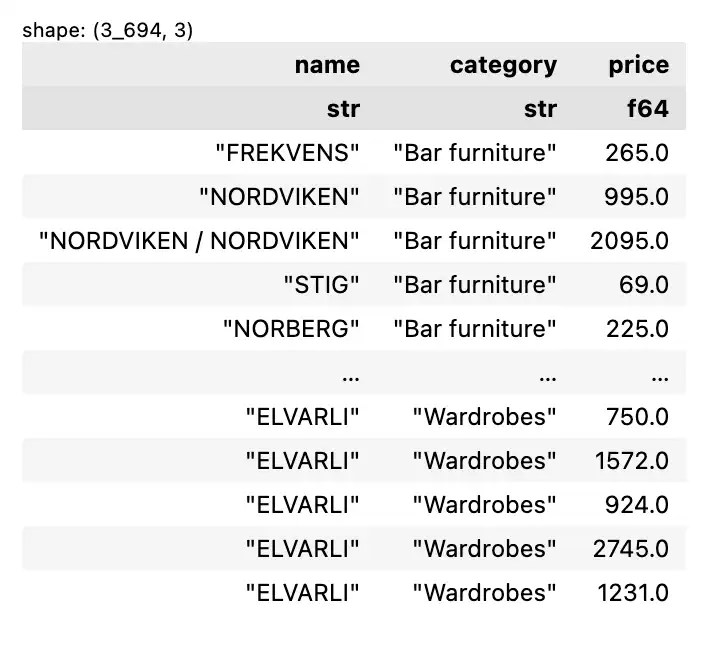
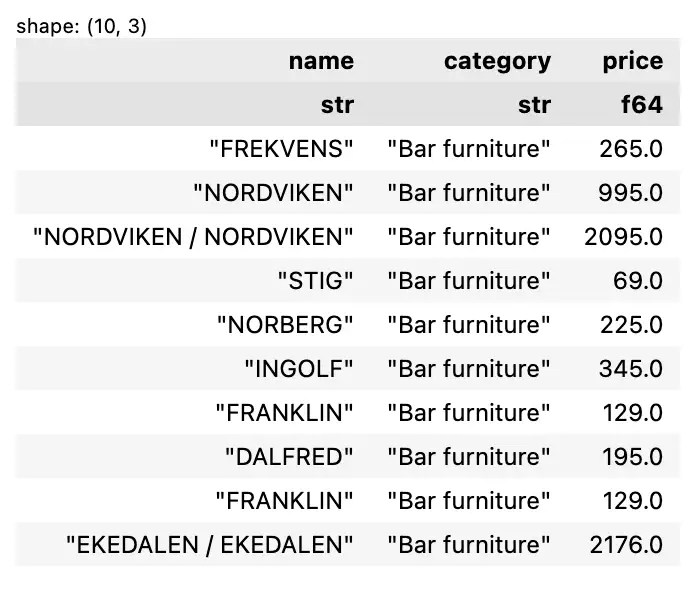
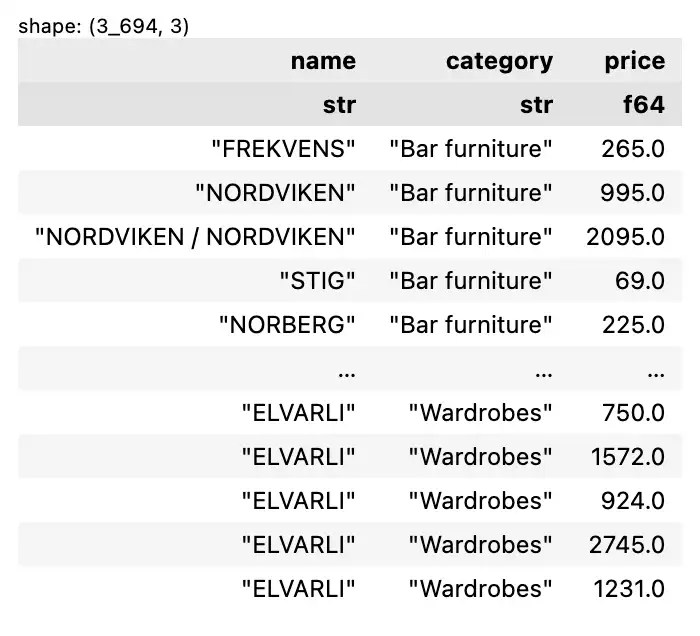
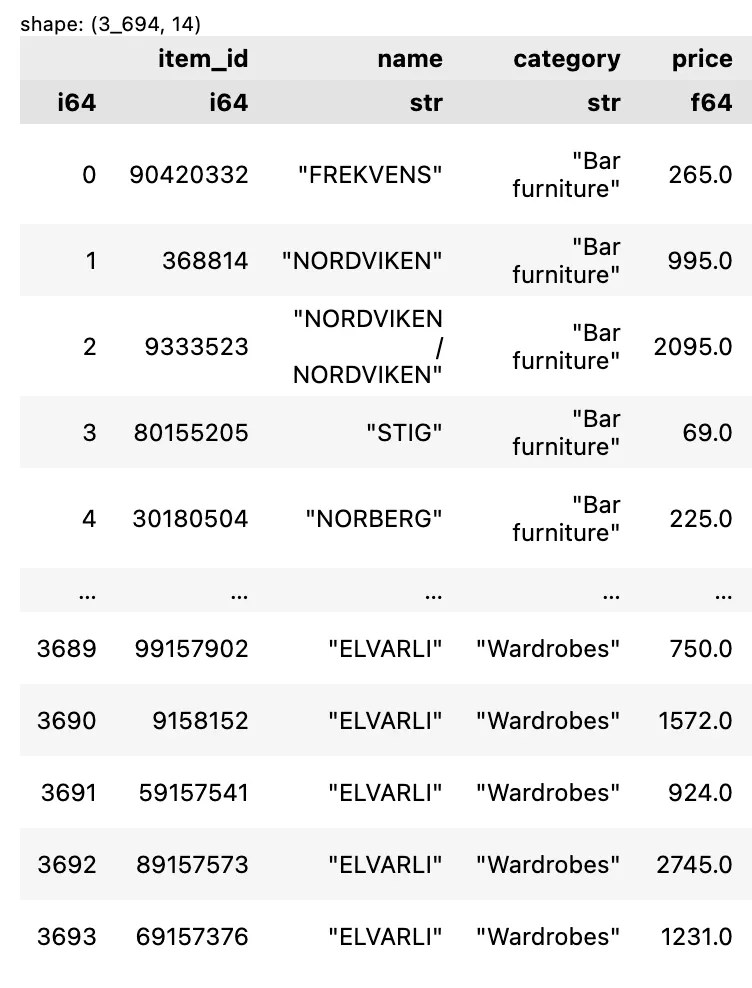
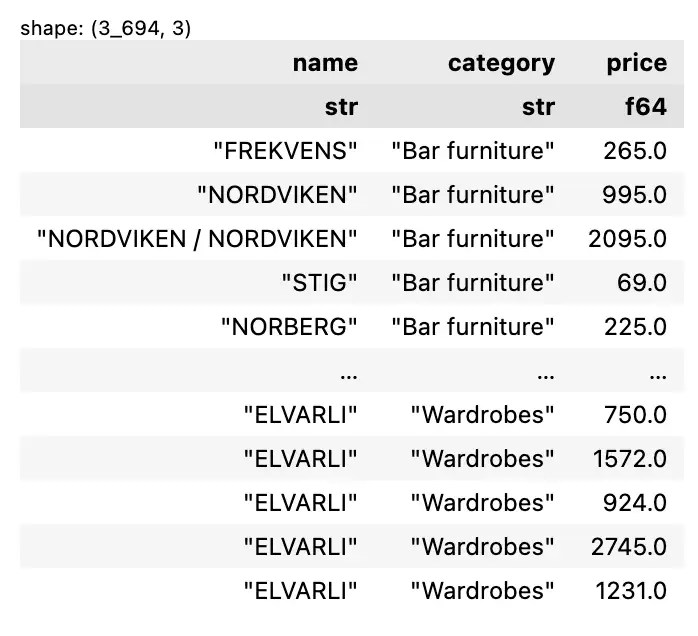
    หรือเลือกเฉพาะ columns ชื่อ ประเภท และราคา และ rows ทั้งหมด:

    df[["name", "category", "price"]]
    

    ผลลัพธ์:

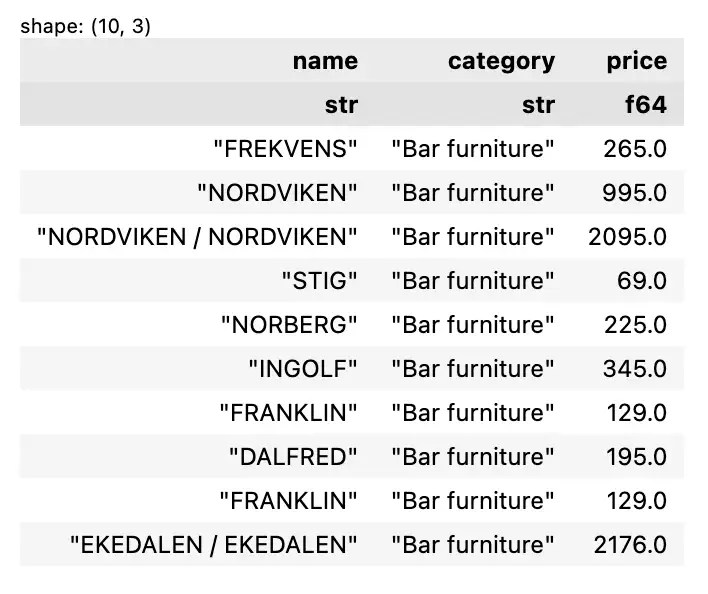
    ถ้าต้องการทั้ง rows และ columns ให้เรากำหนดทั้งสองอย่าง เช่น ข้อมูล 10 rows แรก โดยเลือกเฉพาะ columns ชื่อ ประเภท และราคา:

    df[0:10, ["name", "category", "price"]]
    

    ผลลัพธ์:

    .

    🔪 3.2 Using slice() & select()

    เราสามารถใช้ slice() และ select() เพื่อเลือกข้อมูลแทนการใช้ [] ได้ โดย:

    1. ใช้ slice() เลือก rows
    2. ใช้ select() เลือก columns

    เช่น เลือกข้อมูล 10 rows แรก:

    df.slice(0, 10)
    

    ตัวอย่างผลลัพธ์:

    เลือก columns ชื่อ ประเภท และราคา:

    df.select(["name", "category", "price"])
    

    ผลลัพธ์:

    สุดท้าย เราสามารถใช้ทั้ง slice() และ select() ร่วมกันเพื่อเลือกทั้ง rows และ columns ได้แบบนี้:

    df.slice(0, 10).select(["name", "category", "price"])
    

    ผลลัพธ์:


    👀 Section 4. Filter

    เรากรองข้อมูลได้ด้วย filter() ซึ่งรับรองการกรองแบบ 1 เงื่อนไข และมากกว่า 1 เงื่อนไข

    .

    ☝️ 4.1 One Condition

    ตัวอย่างการกรองแบบ 1 เงื่อนไข เช่น เลือกเฉพาะข้อมูลของ outdoor furniture:

    df.filter(pl.col("category") == "Outdoor furniture")
    

    Note: สังเกตว่า เราใช้ col() เพื่อระบุ column ที่ต้องการ

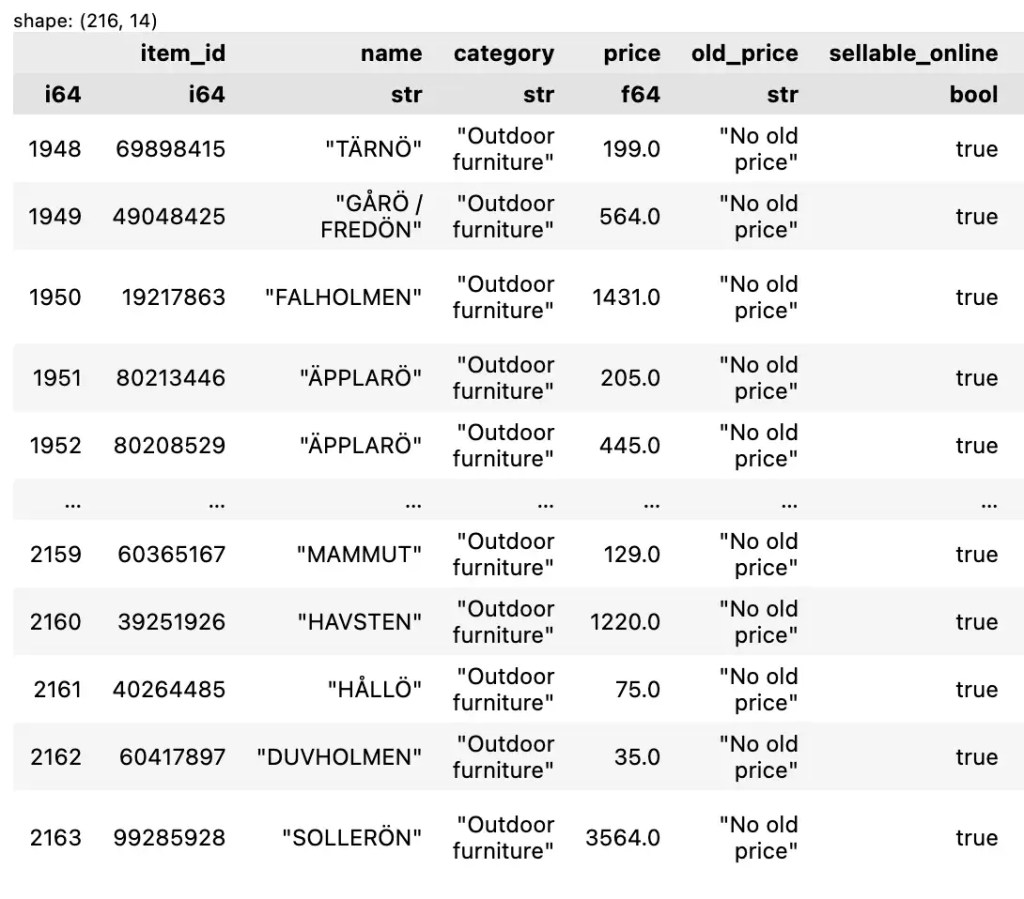
    ตัวอย่างผลลัพธ์:

    .

    🖐️ 4.2 Multiple Conditions

    สำหรับการกรองหลายเงื่อนไข เราจะใช้ logical operator ช่วย:

    OperatorMeaning
    &And
    |Or
    ~Not

    เช่น เลือกข้อมูล outdoor furniture ที่ราคาสูงกว่า 1,000:

    df.filter(
        (pl.col("category") == "Outdoor furniture") &
        (pl.col("price") > 1000)
    )
    

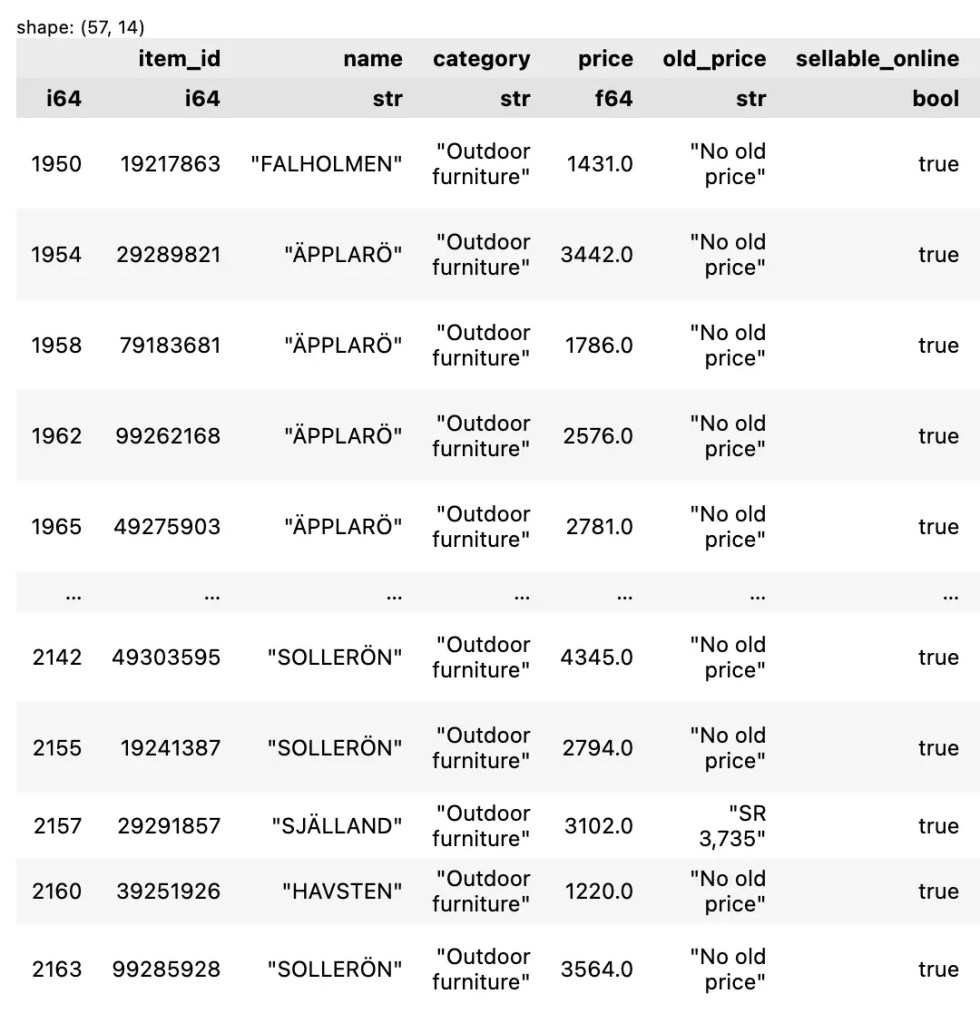
    ตัวอย่างผลลัพธ์:


    ↕️ Section 5. Sort

    สำหรับจัดลำดับข้อมูล เราจะใช้ sort() ซึ่งรองรับการใช้งาน 3 กรณี:

    1. Ascending: เรียงจากน้อยไปมาก (A–Z)
    2. Descending: เรียงจากมากไปน้อย (Z–A)
    3. Multiple columns: เรียงลำดับหลาย columns พร้อมกัน

    .

    ⬆️ 5.1 Ascending

    Default ในการจัดลำดับของ sort() คือ เรียงจากน้อยไปมาก เช่น จัดเรียงข้อมูลตามราคา:

    df.sort("price")
    

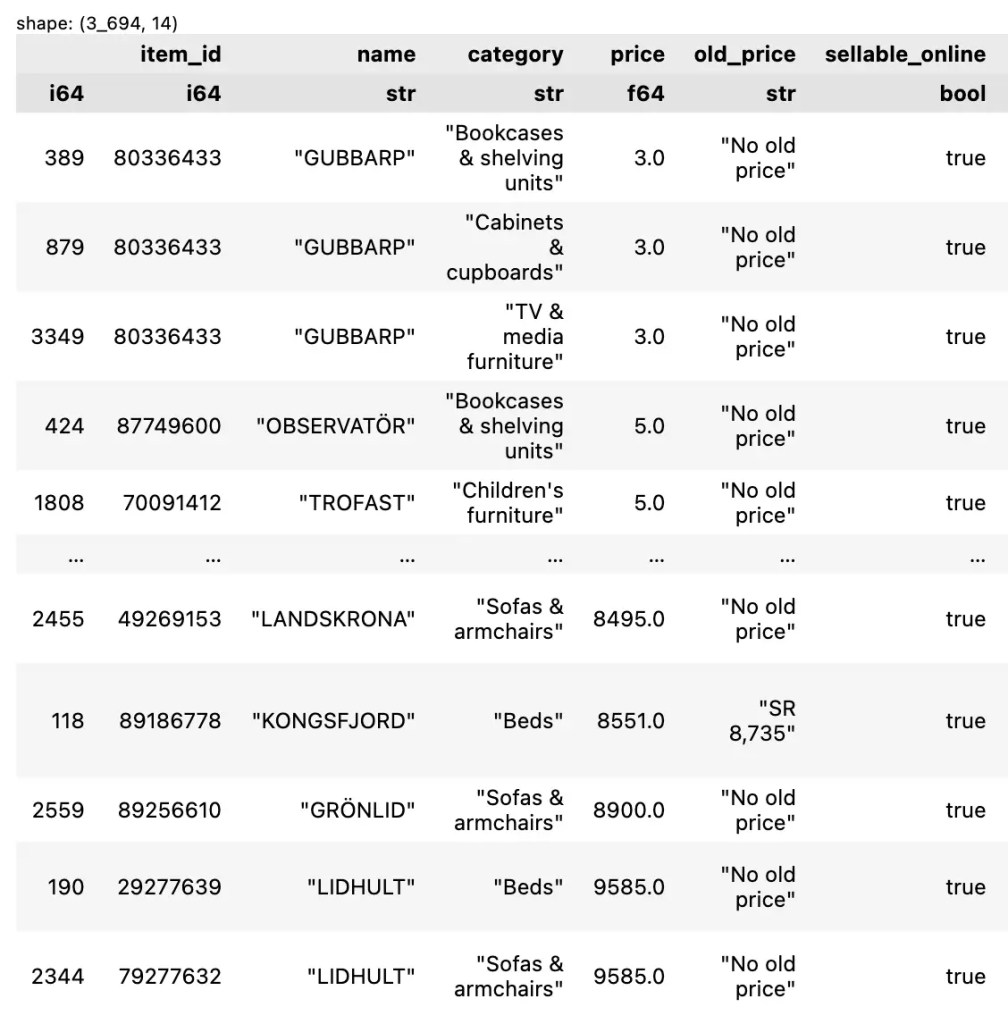
    ตัวอย่างผลลัพธ์:

    .

    ⬇️ 5.2 Descending

    ถ้าต้องการจัดเรียงแบบมากไปน้อย เราจะต้องกำหนด argument descending=True:

    df.sort("price", descending=True)
    

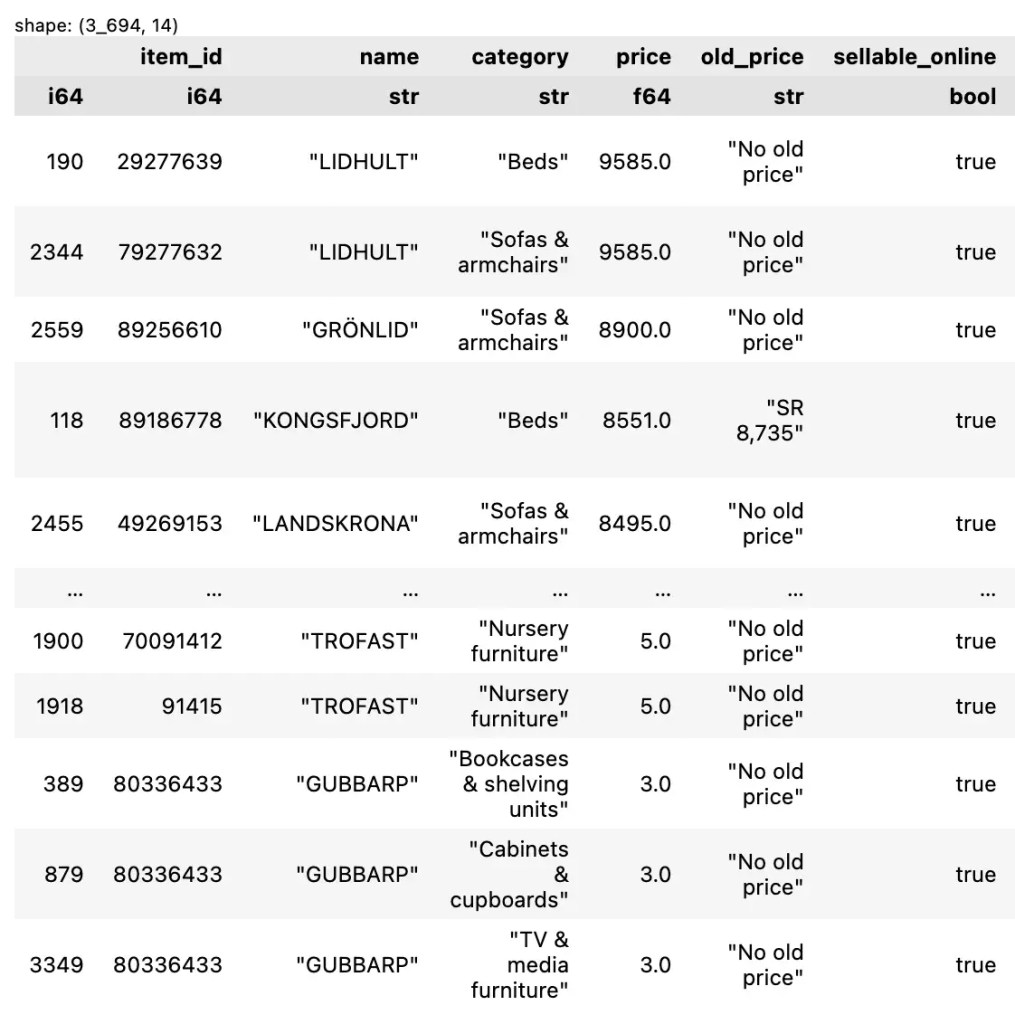
    ตัวอย่างผลลัพธ์:

    .

    🖐️ 5.3 Multiple Columns

    ถ้าต้องการจัดลำดับหลาย columns พร้อมกัน เราจะกำหนด columns และวิธีจัดเรียง (ascending vs descending) เช่น จัดเรียงตามประเภทเฟอร์นิเจอร์ (A–Z) และราคา (Z–A):

    df.sort(
        ["category", "price"],
        descending=[False, True]
    )
    

    ตัวอย่างผลลัพธ์:


    🧮 Section 6. Aggregate

    Aggregate คือ การสรุปข้อมูล เช่น หาค่าเฉลี่ย และทำได้ 2 วิธี:

    1. แบบไม่จัดกลุ่ม ด้วยคำสั่ง select()
    2. แบบจัดกลุ่ม ด้วยคำสั่ง group_by() และ agg()

    .

    🏠 6.1 Basic

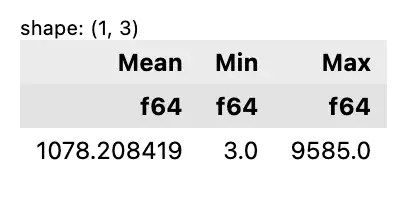
    ตัวอย่างสรุปข้อมูลโดยไม่จัดกลุ่ม เช่น หาค่าเฉลี่ย ค่าต่ำสุด และค่าสูงสุดของราคาเฟอร์นิเจอร์:

    df.select(
        pl.col("price").mean().alias("Mean"),
        pl.col("price").min().alias("Min"),
        pl.col("price").max().alias("Max")
    )
    

    Note: alias() ใช้ตั้งชื่อ column

    ผลลัพธ์:

    .

    🏘️ 6.2 Group By

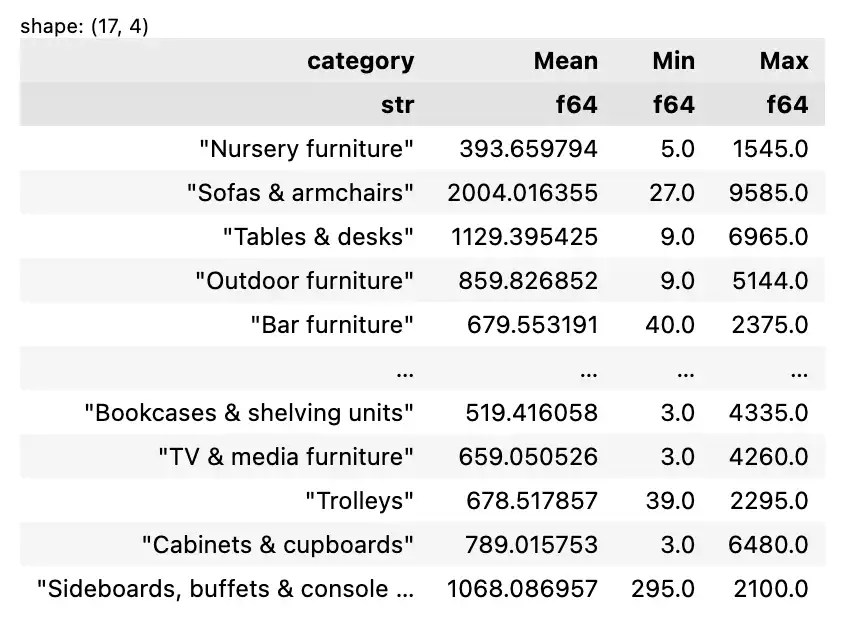
    ตัวอย่างสรุปข้อมูลแบบจัดกลุ่ม เช่น หาค่าเฉลี่ย ค่าต่ำสุด และค่าสูงสุดของราคาเฟอร์นิเจอร์ ตามประเภทเฟอร์นิเจอร์:

    df.group_by("category").agg(
        pl.col("price").mean().alias("Mean"),
        pl.col("price").min().alias("Min"),
        pl.col("price").max().alias("Max")
    )
    

    ตัวอย่างผลลัพธ์:


    💪 Section 7. Mutate

    Mutate หมายถึง การปรับเปลี่ยน columns ที่มีอยู่ เช่น เพิ่มหรือลบ columns

    .

    ➕ 7.1 Add Columns

    ตัวอย่างการเพิ่ม columns เช่น:

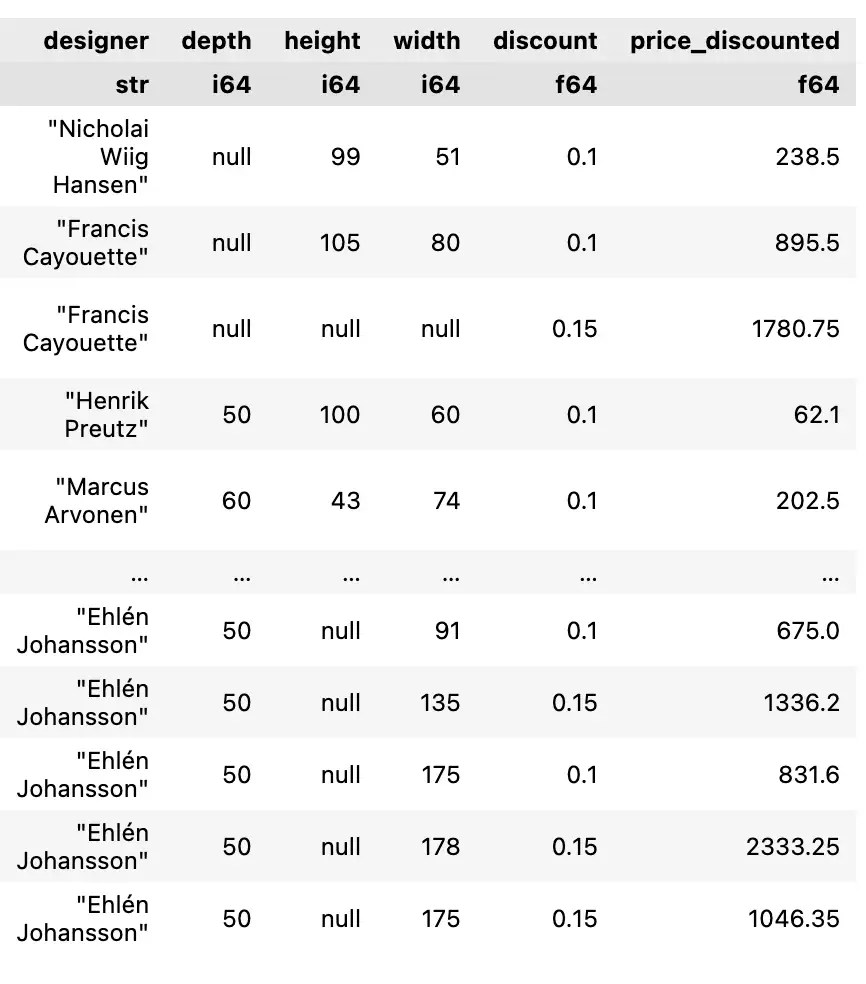
    1. เพิ่ม column ส่วนลด (discount) โดยราคามากกว่า 1,000 จะลด 15% และราคาน้อยกว่านั้นจะลด 10% และ
    2. เพิ่ม column แสดงราคาหลังใช้ส่วนลดแล้ว (price_discounted)

    เราสามารถเขียน code ได้ดังนี้:

    df.with_columns(
        discount = pl.when(pl.col("price") > 1000)
        .then(0.15)
        .otherwise(0.10),
    ).with_columns(
        price_discounted = pl.col("price") * (1 - pl.col("discount"))
    )
    

    Note: เราใช้ when(), then(), otherwise() ช่วยกำหนดเงื่อนไขที่ต้องการ

    ตัวอย่างผลลัพธ์:

    สังเกตว่า columns ใหม่จะอยู่ต่อท้ายสุด

    .

    🗑️ 7.2 Remove Columns

    เราลบ column ได้ด้วย drop() เช่น ลบ columns ราคาเก่า (old_price) และการขายออนไลน์ (sellable_online):

    df.drop(["old_price", "sellable_online"])
    

    ตัวอย่างผลลัพธ์:


    🥱 Section 8. Lazy

    Lazy evaluation เป็นการประมวลผลที่จะรันก็ต่อเมื่อได้รับคำสั่ง ซึ่งช่วยให้การทำงานมีประสิทธิภาพมากขึ้น เพราะการประมวลผลจะไม่เกิดขึ้นจนกว่าจะจำเป็น

    Note: การประมวลผลในทันทีโดยไม่รอคำสั่ง เรียกว่า eager evaluation

    การทำงานแบบ lazy evaluation มีอยู่ 3 ขั้นตอน:

    ขั้นที่ 1. สร้าง LazyFrame ซึ่งเป็นข้อมูลสำหรับ lazy evaluation ด้วย lazy():

    df_lz = df.lazy()
    

    ขั้นที่ 2. เขียนคำสั่งที่ต้องการ เช่น เลือก columns:

    execution = df_lz.select(["name", "category", "price"])
    

    ขั้นที่ 3. สั่งให้ประมวลผลด้วยคำสั่ง collect():

    execution.collect()
    

    ผลลัพธ์:


    🔗 Section 9. Chaining

    Chaining เป็นการเชื่อมต่อ function เพื่อส่งผลลัพธ์จาก function หนึ่งไปยังอีก function หนึ่ง:

    df.function1().function2().function3()...

    Chaining ช่วยให้เราตอบโจทย์ที่ซับซ้อนขึ้นได้ เช่น:

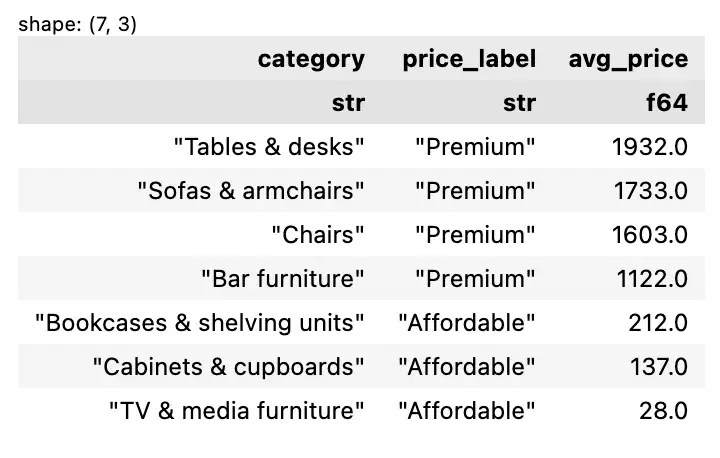
    สำหรับเฟอร์นิเจอร์ที่ Francis Cayouette ออกแบบ ประเภทไหนจัดว่าเป็น “Premium” (ราคาสูงกว่า 1,000) และ “Affordable” (ราคาน้อยกว่า 1,000)

    เราสามารถใช้ polars เพื่อตอบโจทย์ได้แบบนี้:

    df_lz.filter(
        pl.col("designer") == "Francis Cayouette"
    ).group_by(
        "category"
    ).agg(
        pl.col("price").mean().round().alias("avg_price")
    ).with_columns(
        pl.when(pl.col("avg_price") > 1000)
        .then(pl.lit("Premium"))
        .otherwise(pl.lit("Affordable"))
        .alias("price_label")
    ).sort(
        "avg_price",
        descending=True
    ).select(
        [
            "category",
            "price_label",
            "avg_price"
        ]
    ).collect()
    

    ผลลัพธ์:


    ⭐️ Summary

    ในบทความนี้ เราได้เห็นวิธีการใช้ polars เพื่อทำงานกับข้อมูลในรูปแบบตาราง ซึ่งสามารถสรุปเป็นการเขียน code 9 กลุ่มได้ดังนี้:

    Section 1. Import package & dataset:

    • import polars as pl
    • pl.read_csv()

    Section 2. Explore:

    • df.shape
    • df.schema
    • df.head()
    • df.glimpse()
    • df.describe()

    Section 3. Select:

    • df[rows, cols]
    • pl.slice()
    • pl.select()

    Section 4. Filter:

    • df.filter()
    • pl.col()
    • &, |, ~

    Section 5. Sort:

    • df.sort()

    Section 6. Aggregate:

    • df.select()
    • df.group_by().agg()
    • alias()

    Section 7. Mutate:

    • df.with_columns()
    • pl.when().then().otherwise()
    • df.drop()

    Section 8. Lazy:

    • df.lazy()
    • collect()

    Section 9. Chaining:

    • df.function1().function2().function()...

    ⏭️ Next Step: DIY

    ใครที่อยากฝึกใช้ polars สามารถดูตัวอย่าง code และ dataset ได้ที่ GitHub


    📃 References


    🔔 ใครที่ชอบบทความนี้ ฝากกด subscribe และติดตามกันได้ที่:

  • AI Literacy: สรุป 31 ข้อคิดการใช้ AI ให้อยู่รอด จาก session แชร์ความรู้ให้กับนักศึกษา ม.หอการค้าไทย

    AI Literacy: สรุป 31 ข้อคิดการใช้ AI ให้อยู่รอด จาก session แชร์ความรู้ให้กับนักศึกษา ม.หอการค้าไทย

    สัปดาห์ที่แล้ว ผมมีโอกาสแชร์ความรู้การใช้ AI ในหัวข้อ AI literacy ให้กับนักศึกษาคณะการศึกษาปฐมวัย มหาวิทยาลัยหอการค้าไทย

    ในบทความนี้ ผมจะมาสรุป 31 ข้อคิดที่ผมแชร์ใน session โดยแบ่งเป็น 5 กลุ่ม:

    1. Why AI literacy: ความสำคัญของ AI literacy
    2. Working with AI: แนวคิดการทำงานกับ AI
    3. How to prompt: วิธีเขียน prompt
    4. Future trends: แนวโน้มของ AI ในอนาคต
    5. Be human: การเป็นมนุษย์ในยุคของ AI

    ถ้าพร้อมแล้ว ไปเริ่มกันเลย


    🤖 Part I. Why AI Literacy

    .

    ข้อ 1. Pareto Principle (80/20 rule)

    Pareto principle เป็น mental model หรือแนวคิดช่วยตัดสินใจที่บอกว่า 80% ของความสำเร็จมักมาจาก 20% ของสิ่งที่เราทำ

    ในยุคที่ AI เข้ามามีบทบาทในหลายด้านของชีวิต ทักษะ AI เป็นสิ่งง่าย ๆ ที่เราทำได้เพื่อช่วยให้เราอยู่รอด

    การเรียนรู้เกี่ยวกับ AI คือ 20% ที่เราทำได้ เพื่อให้โอกาสอยู่รอดถึง 80%

    .

    ข้อ 2. What is AI literacy?

    AI literacy คือ ความเข้าใจและความสามารถในการใช้งาน AI ได้อย่างมีประสิทธิภาพ

    .

    ข้อ 3. AI can do many things

    AI สามารถทำได้หลายอย่าง เช่น:

    • Content: สร้าง content เช่น ข้อความ ภาพ เสียง และวิดีโอ
    • Analysis: วิเคราะห์ข้อมูลขนาดใหญ่อย่างรวดเร็ว
    • Automation: ทำงานโดยอัตโนมัติ (เช่น คุยกับลูกค้าในขณะที่เราหลับ)

    .

    ข้อ 4. Jobs at risk

    ความสามารถของ AI ทำให้มีหลายงานเสี่ยงที่จะถูกแทนที่ แม้กระทั่งงานที่ปกติจะต้องใช้มนุษย์ เช่น:

    • ล่าม/นักแปลภาษา
    • นักเขียน
    • โปรแกรมเมอร์
    • Customer service

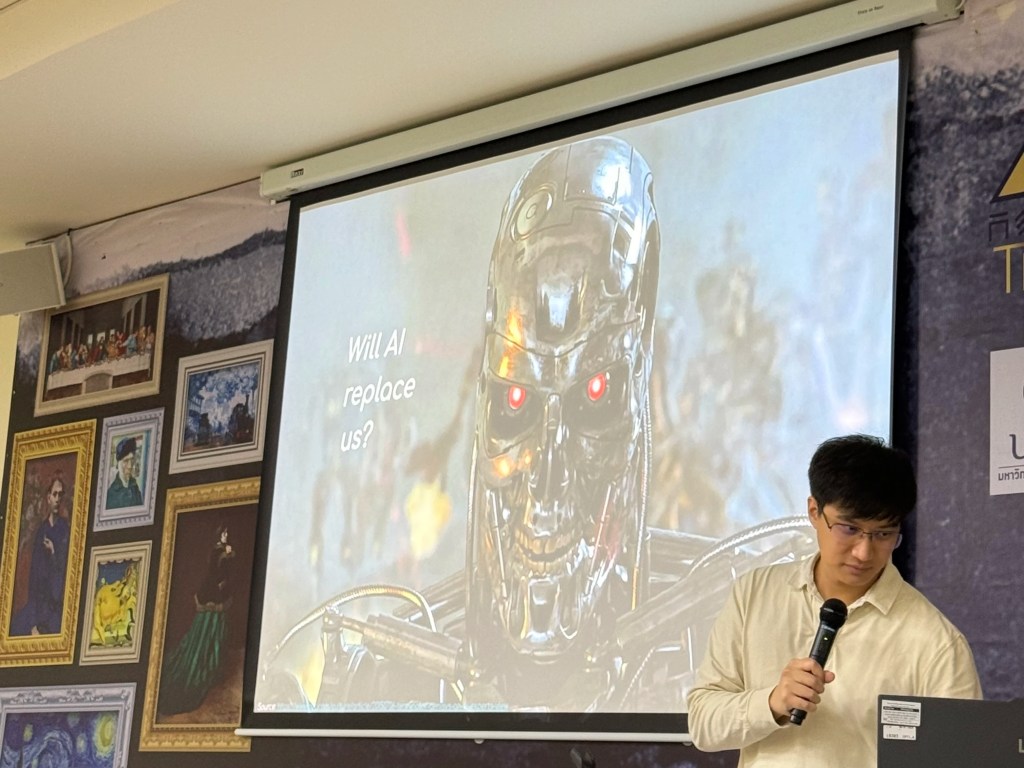
    เมื่อเป็นอย่างนี้ AI จะมาแทนที่มนุษย์ไหม?

    .

    ข้อ 5. AI still has limitations

    แม้ AI จะทำได้หลายอย่าง แต่ก็ยังมีข้อจำกัดอยู่ เช่น:

    .

    ข้อ 6. We must not fear AI, but people who use AI

    ด้วยข้อจำกัดของ AI เรายังไม่ต้องกลัวว่า AI จะมาแทนที่เรา

    แต่เราควรจะกลัวคนที่ใช้ AI เป็นมากกว่า

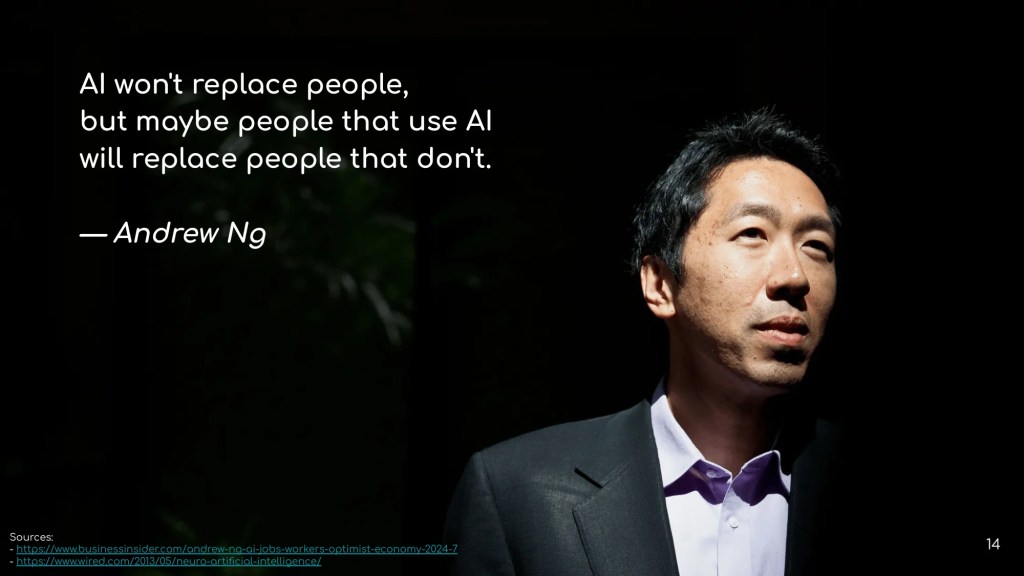
    AI won’t replace people, but maybe people that use AI will replace people that don’t. — Andrew Ng

    คนที่ใช้ AI เป็นสามารถไปได้ไกลกว่าคนอื่น

    เช่น ถ้าไม่ใช้ AI เราอาจจะใช้เวลา 2 วันเพื่อเขียนรายงานส่งอาจารย์

    แต่เมื่อใช้ AI เราอาจใช้เวลาแค่ 2 ชั่วโมง และมีเวลาสำหรับอ่านหนังสือสอบมากขึ้น ทำให้เรามีโอกาสได้เกรดที่ดีกว่าคนอื่น

    .

    ข้อ 7. The one who survives is the one who levels up

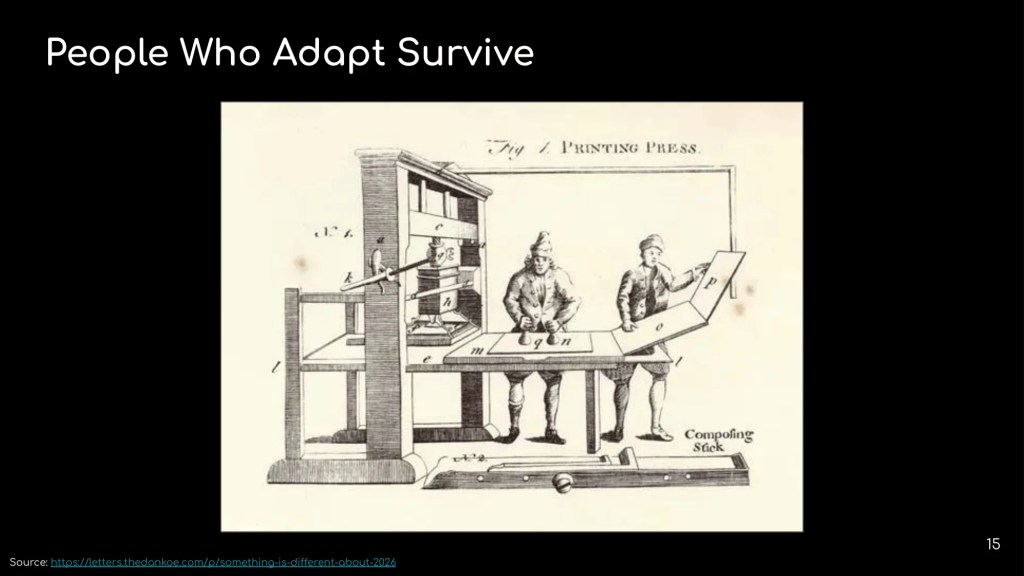
    แต่ละครั้งที่มีเทคโนโลยีใหม่เกิดขึ้น คนที่อยู่รอด คือ คนที่ยกระดับตัวเอง

    สมัยก่อน เราผลิตหนังสือโดยใช้ scribe หรือชาวบ้านที่ฝึกคัดลอกหนังสือมาโดยเฉพาะ scribe ใช้เวลาฝึกฝนนานหลายปีกว่าจะสามารถคัดหนังสือได้

    วันหนึ่ง เครื่องพิมพ์ถูกพัฒนาขึ้น เราสามารถพิมพ์หนังสือได้หลายพันหน้าในวันเดียว โดยไม่ต้องพึ่ง scribe

    ความต้องการ scribe ลดน้อยลงเรื่อย ๆ และ scribe ที่ยึดติดกับวิธีการผลิตหนังสือแบบเดิม ก็ค่อย ๆ หายไปพร้อมกับความต้องการของตลาด

    ส่วน scribe ที่ปรับตัวเข้าหาเทคโนโลยี และฝึกควบคุมเครื่องพิมพ์ ยังคงอยู่รอดต่อไป

    การมาถึงของ AI ก็เหมือนเครื่องพิมพ์ ถ้าเราไม่เรียนรู้ที่จะใช้ AI เราก็จะค่อย ๆ ถูกลืม เหมือนกับ scribe ที่ยังคัดหนังสือด้วยมือ

    .

    ข้อ 8. We are at a crossroad: choose

    AI พัฒนาเร็วขึ้นและก้าวกระโดดมากขึ้นเรื่อย ๆ

    ในช่วงแรกที่ ChatGPT เปิดตัวใหม่ ๆ เราต้องรอนานหลายเดือนกว่าจะได้ใช้ ChatGPT เวอร์ชั่นใหม่ที่มีความสามารถไม่ต่างจากเวอร์ชั่นก่อนหน้ามากนัก

    ในปัจจุบัน เราจะเห็น ChatGPT มีการอัปเดตที่ถี่ขึ้น และในอัปเดตแต่ละครั้ง ChatGPT มีความสามารถมากกว่าเวอร์ชั่นก่อนมาก

    การที่ AI พัฒนาเร็วขึ้นเรื่อย ๆ ทำให้เรามีเวลาปรับตัวน้อยลงเรื่อย ๆ

    และตอนนี้ เราเหมือนอยู่ที่ทางแยกที่เราจะต้องเลือกว่า เราจะเรียนรู้การใช้ AI ให้เป็นและอยู่รอดในยุคของ AI หรือเราจะใช้ AI แบบเดิม ๆ และถูกทิ้งไว้ข้างหลัง

    The people who will come out of this well won’t be the ones who mastered one tool. They’ll be the ones who got comfortable with the pace of change itself. — Matt Shumer


    💼 Part II. Working With AI

    .

    ข้อ 9. Maslow’s hammer

    I suppose it is tempting, if the only tool you have is a hammer, to treat everything as if it were a nail. — Abraham Maslow

    Maslow’s hammer เป็น mental model ที่บอกว่า เครื่องมือสามารถจำกัดมุมมองของเราได้

    เช่น ถ้าเรามีค้อน เราจะมองทุกอย่างเป็นตะปู

    ในยุคของ AI เราอาจมองว่าทุกอย่างแก้ได้ด้วย AI:

    • ทำงานเร็วขึ้น
    • ผิดพลาดน้อยลง
    • มีเวลามากขึ้น

    แต่ไม่ใช่ทุกปัญหาจะแก้ได้ด้วย AI เพราะ AI ไม่ใช่เครื่องมือสำหรับแก้ทุกอย่าง

    ถ้าเราอยากตอกตะปู เราจะต้องใช้ค้อน ไม่ใช่ AI

    การใช้ AI ที่ถูกต้อง คือ เริ่มต้นจากปัญหาและความต้องการของเรา แล้วเลือกเครื่องมือที่ตอบโจทย์ ซึ่งเครื่องมือนั้นอาจจะเป็น AI หรือไม่ก็ได้

    .

    ข้อ 10. AI is built in man’s image

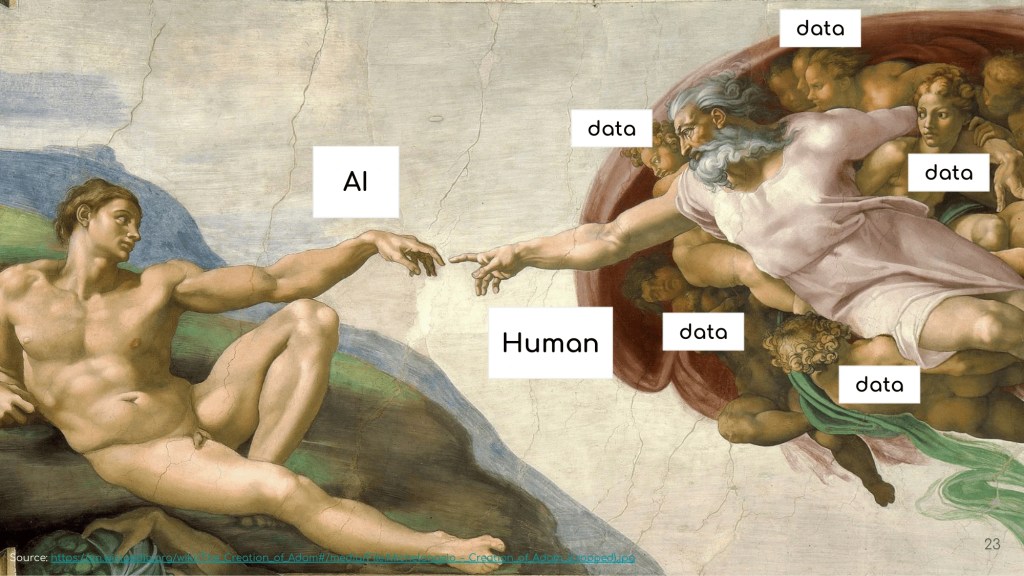
    AI เกิดจากการ train model ด้วยข้อมูลจากอินเทอร์เน็ตซึ่งมาจากมนุษย์

    Human -> Data -> Train -> AI

    เพราะ AI ถูกสร้างจากข้อมูลของมนุษย์ และเรามองได้ว่า AI เป็นเหมือนเป็นมนุษย์คนหนึ่ง

    .

    ข้อ 11. AI as capable but junior assistant

    ถ้าเรามอง AI เป็นคน AI จะเป็นเหมือนผู้ช่วยที่มีความรู้รอบด้านและมีศักยภาพสูง

    แต่สิ่งเดียวที่ผู้ช่วยคนนี้ยังขาดไป คือ ทิศทาง

    .

    ข้อ 12. Even a fried egg is hard to get right

    การทำงานกับ AI ก็เหมือนสั่งไข่ดาว แม้จะดูง่าย แต่ก็ไม่ง่ายอย่างที่คิด

    บางครั้ง เราอยากกินไข่ไม่สุก แต่ได้แบบสุกมาแทน

    บางครั้ง เราอยากให้ AI สร้างรูปในแบบที่เราคิด แต่ไม่เคยได้ภาพนั้นสักที

    .

    ข้อ 13. Principal-agent dilemma

    Principal-agent dilemma เป็น mental model ที่บอกว่า คนทำงาน (agent) มักทำตามความต้องการของคนสั่ง (principal) ไม่ได้ เพราะทั้งสองฝ่ายมีข้อมูลไม่เท่ากัน

    ในตัวอย่าง เราไม่ได้ไข่ดาวที่ต้องการ เพราะคนทอดไข่ไม่รู้ว่าเราชอบไข่สุกหรือไม่สุก

    เช่นเดียวกัน AI สร้างรูปที่เราต้องการไม่ได้ เพราะ AI ไม่รู้ว่ารูปที่เราคิดต้องการเป็นยังไง

    .

    ข้อ 14. Fixing the egg

    ถ้าเราอยากได้ไข่ดาวที่ต้องการ เราจะต้องทำให้ AI รู้เท่ากับเรา เช่น ให้ข้อมูลอย่าง:

    1. Goal: ภาพปลายทางที่เราต้องการ (ภาพแมวน่ารัก)
    2. Steps: ขั้นตอนที่จะไปถึงจุดหมาย (วาดแมวก่อน แล้วค่อยวาดองค์ประกอบอื่น ๆ ในภาพ)
    3. Constraints: ข้อจำกัดหรือสิ่งที่ไม่ควรทำ (เช่น ไม่เอาแมวสีดำ ฉากหลังต้องดูสดใส)

    .

    ข้อ 15. Human in the loop: taste and iterate

    Taste: เมื่อไข่ดาวมาเสิร์ฟ เราจะไม่รู้ว่าไข่ดาวอร่อยไหม จนกว่าจะได้ลองชิมด้วยตัวเอง

    การทำงานกับ AI ก็เช่นกัน เราไม่ควรจะบอกว่า สิ่งที่ AI ส่งกลับมาดีไหม จนกว่าจะได้เช็กด้วยตัวเอง

    Iterate: ถ้าชิมแล้วไข่ดาวไม่อร่อย เราจะบอกกับคนทอดว่า ไม่อร่อยเพราะอะไร และจะทำยังไงให้อร่อยมากขึ้น และรอชิมไข่จานต่อไป

    ถ้าสิ่งที่ AI ส่งกลับมาไม่ตรงใจ เราควรจะบอก AI ว่าอะไรที่ยังไม่ถูกใจ เพื่อให้ AI ปรับผลลัพธ์และส่งกลับมาให้เราเช็กจนกว่าเราจะพอใจกับงานของ AI

    .

    ข้อ 16. Be accountable

    เราควรจะเช็กงานของ AI ทุกครั้ง เพราะถ้าเราไม่รับผิดชอบกับงานของ AI เราอาจจะเป็นเหมือนทนายความจากออสเตรเลียที่ถูกตรวจสอบ หลังจากศาลพบว่าเอกสารที่ทนายนำส่งเป็นข้อมูลที่ไม่มีอยู่จริง

    แม้ทนายจะอ้างว่ารู้เท่าไม่ถึงการณ์ว่า AI ที่บริษัทให้ใช้สามารถสร้างข้อมูลที่ไม่มีอยู่จริงได้ และตัวเองควรตรวจสอบข้อมูลจาก AI ก่อน ศาลยังสั่งให้ทนายงดว่าความด้วยตัวเองเป็นเวลา 2 ปี โดยในระยะเวลานี้จะต้องทำงานเป็นลูกจ้างของคนอื่น และต้องรายงานต่อศาลทุกไตรมาส

    ดังนั้น ไม่ว่างานของ AI จะดูดีขนาดไหน เราควรจะตรวจสอบด้วยตัวเองก่อนที่จะนำงานไปใช้จริง


    👷 Part III. How to Prompt

    .

    ข้อ 17. Prompt and prompt engineering

    Prompt คือ คำสั่งสำหรับทำงานกับ AI ซึ่งจะเป็น:

    • ข้อความ
    • ภาพ
    • เสียง

    หรือสื่ออื่น ๆ ก็ได้

    Prompt engineering คือ การออกแบบ prompt เพื่อทำให้ AI ทำงานได้อย่างมีประสิทธิภาพสูงสุด

    .

    ข้อ 18. Effective prompts

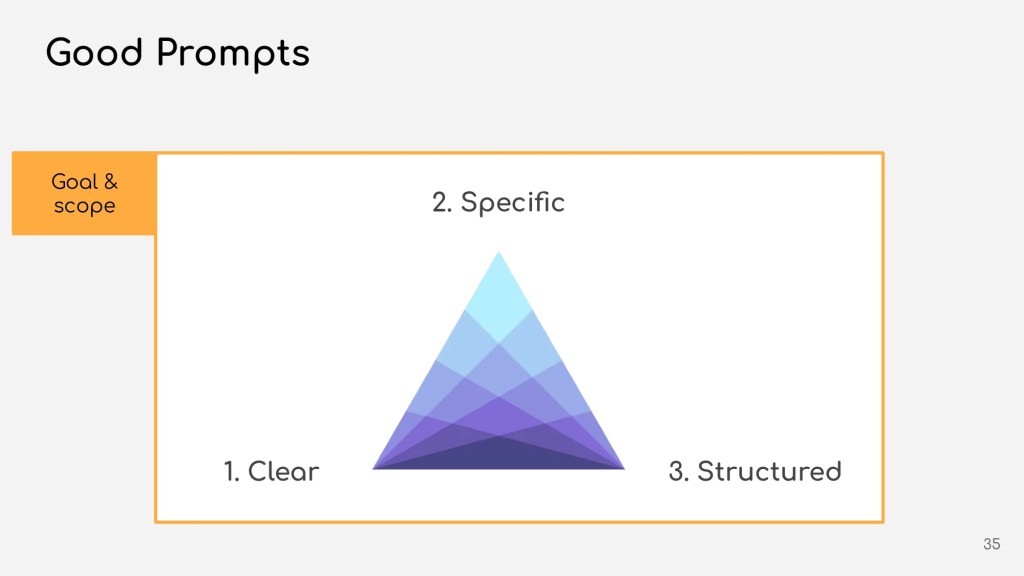
    Prompt ที่ดีมีลักษณะ 3 อย่าง:

    1. Clear: ชัดเจนว่า สิ่งที่ต้องทำคืออะไร
    2. Specific: มีความเจาะจง ไม่คลุมเครือ
    3. Structured: มีโครงสร้างที่ดี รู้ว่าข้อมูลไหนคืออะไรและต้องใช้ยังไง

    นอกจากนี้ ทั้ง 3 อย่างต้องทำงานภายในเป้าหมายและขอบเขตงานที่เราต้องทำ

    .

    ข้อ 19. How and what of prompting

    การเขียน prompt ที่เราจะต้องรู้มี 2 อย่าง:

    1. Prompting technique (how): วิธีเขียน prompt ให้ AI เข้าใจ
    2. Prompting framework (what): สิ่งที่เราจะควรใส่ลงใน prompt

    .

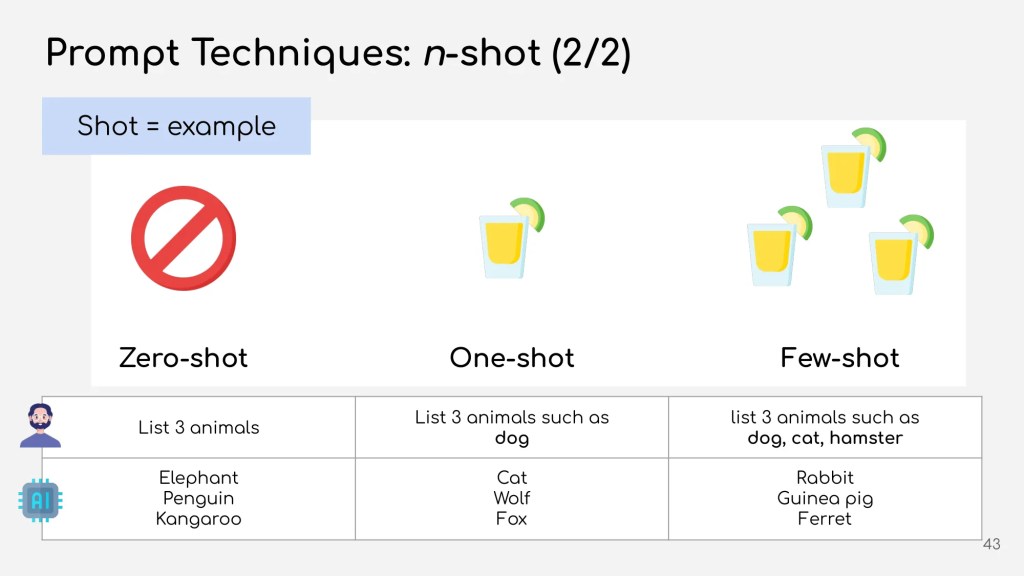
    ข้อ 20. Prompting technique: n-shot

    n-shot technique เป็นการสั่ง AI โดยให้ตัวอย่าง (shot) และแบ่งได้เป็น 3 ประเภท:

    • Zero-shot: สั่งโดยไม่ให้ตัวอย่าง
    • One-shot: สั่งโดยให้ 1 ตัวอย่าง
    • Few-shot: สั่งโดยให้หลายตัวอย่าง

    เราจะใช้ shot น้อยเมื่อต้องการให้คำตอบของ AI มีความหลากหลาย (มีความสร้างสรรค์)

    และใช้ shot เยอะเมื่อต้องการให้คำตอบของ AI ใกล้เคียงกับภาพที่เราต้องการมากที่สุด

    ตัวอย่างการใช้ n-shot:

    จะสังเกตว่า ยิ่งให้ shot เยอะ คำตอบของ AI ก็จะยิ่งใกล้เคียงกับตัวอย่างมากขึ้น (zero-shot ให้สัตว์ป่า แต่ few-shot ให้สัตว์เลี้ยง)

    .

    ข้อ 21. Prompting technique: COT

    COT ย่อมาจาก chain-of-thought ซึ่งเป็นวิธีเขียน prompt โดยกำหนดวิธีคิดให้กับ AI

    เช่น แทนที่ให้ AI แก้โจทย์เลขในทันที:

    A ซื้อส้ม 2 ลูก ลูกละ 10 บาท A ต้องจ่ายเงินเท่าไร

    เราจะสอนให้ AI คิดก่อน:

    A ซื้อส้ม 2 ลูก ลูกละ 10 บาท
    วิธีคิด:
    1. หาว่า ส้มราคาลูกละเท่าไร
    2. คูณจำนวนราคาด้วยจำนวนส้มที่ต้องซื้อ
    A ต้องจ่ายเงินเท่าไร

    COT เหมาะกับงานที่ซับซ้อนหรือมีหลายขั้นตอน เช่น:

    • แก้สมการเลข
    • วิเคราะห์งานวิจัย
    • การวางแผนเชิงกลยุทธ์

    .

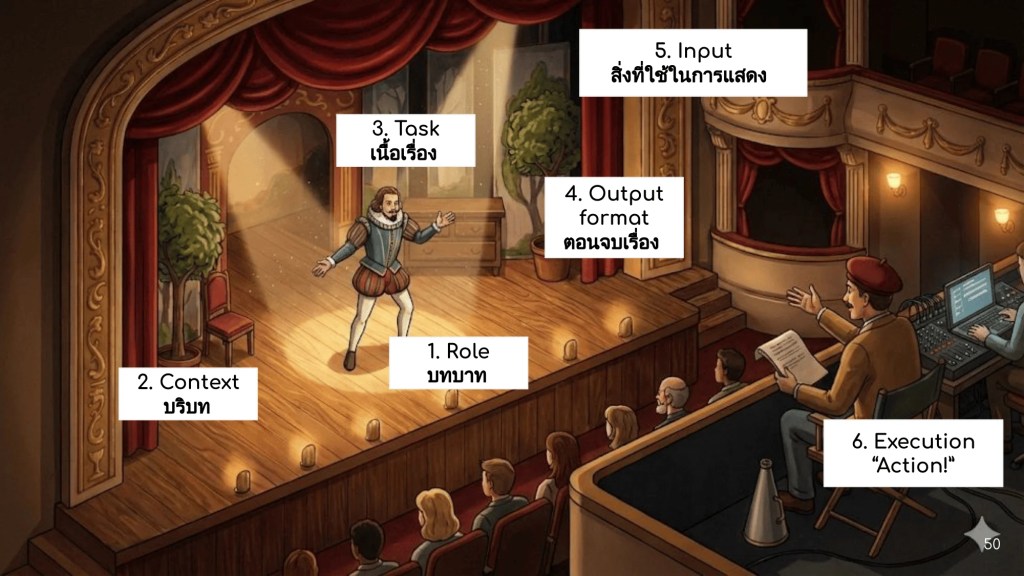
    ข้อ 22. Prompting framework: theatre model

    Theatre model เป็นแนวการเขียน prompt ที่มนุษย์เป็นเหมือนผู้กำกับ และ AI เป็นนักแสดงบนเวทีของเรา

    Theatre model ประกอบด้วย 6 ส่วน ได้แก่:

    1. Role: บทบาทของ AI
    2. Context: setting ของละคร (บริบทในการทำงาน)
    3. Task: การเดินเรื่อง (เป้าหมาย ขั้นตอน และข้อจำกัด)
    4. Output format: จุดจบของเรื่องจะเป็นยังไง (ส่งที่ AI ต้องส่งให้เรา)
    5. Input: อุปกรณ์ที่จะให้นักแสดงใช้ (ข้อมูลสำหรับ AI)
    6. Execution: “Action!” (คำสั่งให้ AI)

    ตัวอย่างการใช้ theatre model เพื่อสร้างสูตรอาหารใหม่:

    PartExample
    Roleคุณเป็น cook มืออาชีพ มีประสบการณ์ทำงานอาหารไทยและนานาชาติมากกว่า 30 ปี
    Contextคุณกำลังเข้าร่วมแข่งอยู่ในรายการทำอาหาร เพื่อชิงเงินรางวัล 10 ล้านบาท โจทย์คืออาหารไทยฟิวชั่น
    Taskคิดสูตรอาหารไทยฟิวชัน โดยต้องมีวัตถุดิบที่กำหนดอยู่ในอาหาร

    ตั้งชื่อจาน และบอกวิธีการเตรียมอาหาร

    อาหารจะต้องมีความเป็นไทย และถูกปากคนทุกชาติ

    ห้ามเป็นอาหารที่มีอยู่แล้ว
    Output formatส่งกลับมาในรูปแบบนี้:

    ชื่ออาหาร:
    xxx

    ขั้นตอนการทำ:
    xxx
    Inputวัตถุดิบที่ต้องมี:
    1. ใบโหระพา
    2. เนื้อไก่
    3. ผักชี
    Executionคิดสูตรอาหารเลย

    .

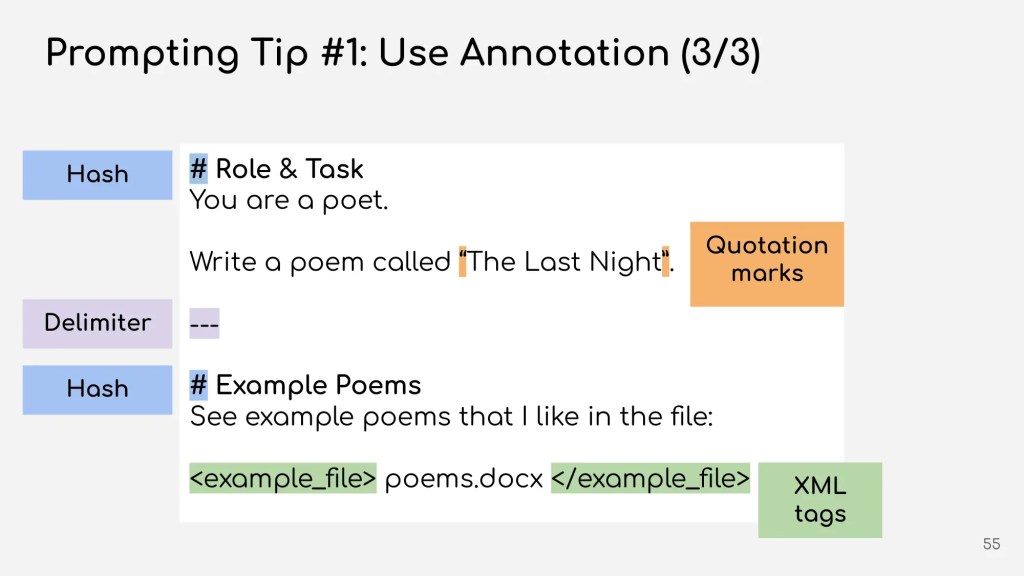
    ข้อ 23. Annotation

    เพื่อช่วยให้ AI เข้าใจ prompt ได้มากขึ้น เราควรจัด format ให้อ่านง่ายโดยใช้ XML tags และ markdown:

    • XML tags เช่น <example>ตัวอย่าง</example>
    • Markdown เช่น # และ *

    อ่านเพิ่มเติมเกี่ยวกับ XML tags และ markdown

    .

    ข้อ 24. Iterate

    Prompt แรกอาจจะไม่ให้ในสิ่งที่เราต้องการเสมอไป

    สิ่งที่เราต้องทำ คือ วิเคราะห์ว่า ผลลัพธ์ยังขาดอะไรไป และมีส่วนไหนของ prompt ที่เราปรับได้ แล้วส่ง prompt ที่แก้แล้วให้ AI อีกครั้ง

    ทำอย่างนี้วนไปจนกว่าจะได้ผลลัพธ์ที่เราต้องการ

    .

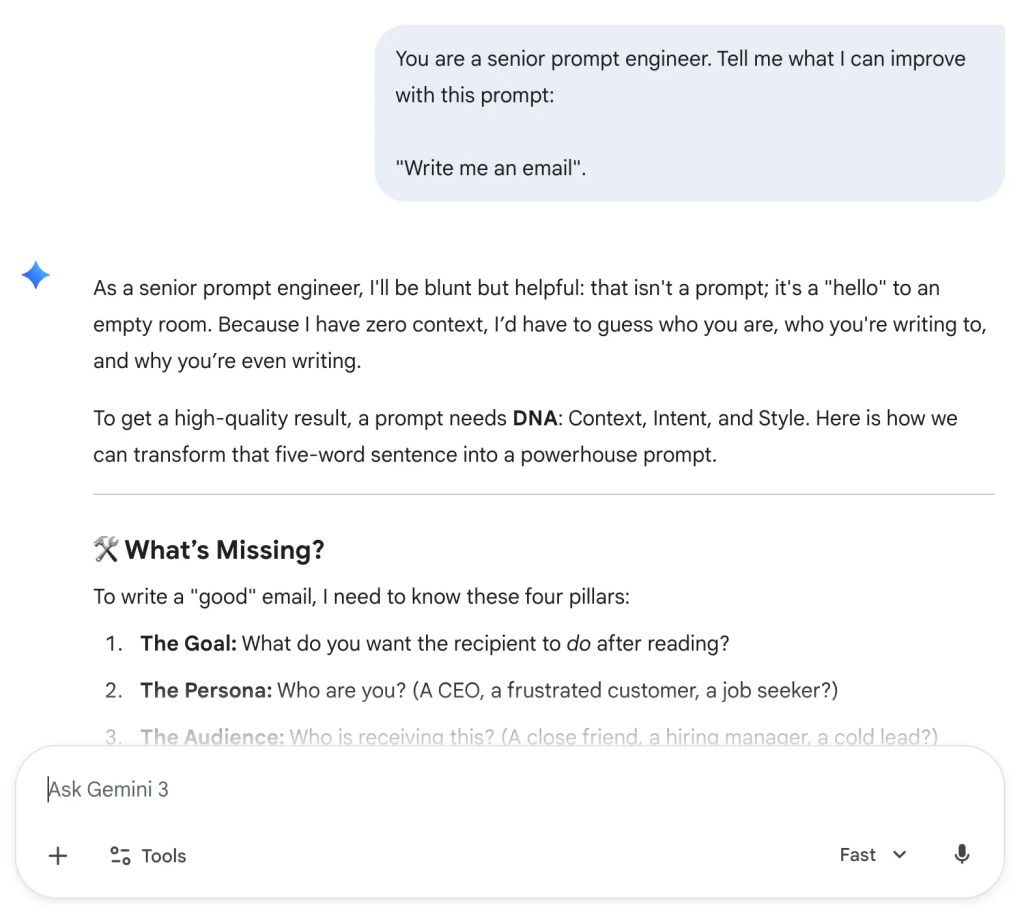
    ข้อ 25. Ask AI

    ถ้าไม่รู้ว่าจะเขียน prompt ยังไง หรือ prompt ยังขาดอะไรไป เราสามารถถาม AI ได้ให้ช่วยเราได้

    ตัวอย่าง:


    .

    ข้อ 26. AI, more agentic

    AI จะทำงานแบบอัตโนมัติมากขึ้น และมีมนุษย์เข้ามาเกี่ยวข้องน้อยลง

    .

    ข้อ 27. Human and AI getting closer

    เพราะ AI จะทำงานได้ด้วยตัวเองมากขึ้น AI จะเข้ามามีบทบาทในการทำงานมากขึ้น ทำให้มนุษย์จะทำงานกับ AI อย่างใกล้ชิดมากขึ้น


    😌 Part V. Be Human

    .

    ข้อ 28. Humans required

    แม้ว่า AI จะสามารถทำงานหลาย ๆ อย่างแทนมนุษย์ได้ แต่ในบางงาน เรายังต้องการมนุษย์ด้วยกันเองอยู่ เช่น:

    • นักบิน: แม้ AI จะขับเครื่องบินได้ แต่เราก็อยากให้มีนักบินที่สามารถแก้ปัญหาเฉพาะหน้าอยู่ในห้องนักบิน
    • หมอ: แม้ AI จะวินิจฉัยโรคได้แม่นยำกว่ามนุษย์ แต่เราก็ยังต้องการให้มีคนบอกข่าวดี/ร้ายเป็นคนที่เข้าใจความรู้สึกของเรา
    • Customer service: บางครั้ง เราก็ต้องการคุยกับคนมากกว่า chatbot ที่ตอบเป็น pattern

    .

    ข้อ 29. Skill, like muscle

    ทักษะก็เป็นเหมือนกล้ามเนื้อ เมื่อไม่ได้ใช้งาน ก็จะอ่อนแอลงเรื่อย ๆ

    ถ้าเราใช้ AI ทำทุกอย่างให้เรา ทักษะที่เราเคยมีก็จะค่อย ๆ หายไป

    .

    ข้อ 30. What not to outsource to AI

    4 ทักษะที่เราควรฝึกพัฒนา และไม่ควรให้ AI ทำแทนเรา ได้แก่:

    1. Thinking: การคิด เพราะถ้าเราคิดไม่ได้แล้ว เราจะไม่ประเมินงานของ AI ได้ว่าดี/ไม่ดี
    2. Learning: ถ้าเราไม่เรียนรู้สิ่งใหม่ ๆ เราจะถูกทิ้งไว้ข้างหลัง โดยเฉพาะในยุคที่การเปลี่ยนแปลงเกิดขึ้นอย่างรวดเร็ว
    3. Writing and reading: การเขียนและการอ่านเป็นทักษะที่ช่วยให้เราคิดและเรียนรู้ได้อย่างมีประสิทธิภาพ
    4. Empathy: การเข้าใจคนอื่นเป็นทักษะที่ช่วยให้เราเข้าใจคนอื่นและเชื่อมโยงถึงกันและกันในแบบที่ AI ยังไม่สามารถทำได้

    .

    ข้อ 31. When to use AI

    3 กรณีที่เราจะใช้ AI:

    1. Routine: ใช้ AI ทำงานจำเจหรืองานที่ต้องเป็นประจำ เพื่อที่เราจะได้โฟกัสงานที่ต้องใช้ความคิดมากขึ้น
    2. What and how: ใช้ AI ทำงานในขณะที่เราโฟกัสกับภาพใหญ่ ซึ่งได้แก่ when (ทำเมื่อไร) และ why (ทำไมต้องทำ)
    3. Brainstorm: ใช้ AI ช่วยระดมความคิด เพราะ AI มีข้อมูลเยอะ และช่วยให้เห็นมุมมองที่เราคิดไม่ถึงมาก่อนได้

    🔔 ใครที่ชอบบทความนี้ ฝากกด subscribe และติดตามกันได้ที่:

  • วิธีใช้ SQLAlchemy วิเคราะห์ข้อมูลจาก Database โดยไม่ต้องออกจาก Python

    วิธีใช้ SQLAlchemy วิเคราะห์ข้อมูลจาก Database โดยไม่ต้องออกจาก Python

    Updated: 31 Jul 2026

    .

    SQLAlchemy เป็น Python package ยอดนิยมสำหรับเชื่อมต่อกับ database ทั้งสำหรับพัฒนาเว็บแอปพลิเคชัน (web application) และการวิเคราะห์ข้อมูล (data analytics)

    นอกจาก SQLAlchemy จะช่วยให้เราเชื่อมต่อกับ database หลากหลายประเภท ไม่ว่าจะเป็น:

    • SQLite
    • PostgreSQL
    • MySQL
    • และอีกมากมาย

    SQLAlchemy ยังช่วยให้เราทำงานกับ database ได้โดยไม่ต้องรู้ SQL (Structured Query Language) ก็ได้ โดยทำหน้าที่เป็น Object-Relational Mapper (ORM) ที่แปลงข้อมูลใน database ให้เป็น Python object ที่เราใช้งานต่อได้

    ในบทความนี้ ผมจะพาทุกคนไปดูวิธีใช้ SQLAlchemy คู่กับ Pandas เพื่อวิเคราะห์ข้อมูลใน database โดยไม่ต้องออกจาก Python กัน

    ถ้าพร้อมแล้ว ไปเริ่มกันเลย


    🚀 Overview

    การทำงานกับ SQLAlchemy มีอยู่ 5 ขั้นตอน:

    1. เชื่อมต่อกับ database
    2. ดูโครงสร้าง database
    3. เขียน SQL
    4. โหลดข้อมูล
    5. วิเคราะห์ข้อมูล

    เราไปดูตัวอย่าง ผ่านการทำงานกับ Chinook SQLite ที่มีข้อมูลของร้านขาย digital media (เช่น ข้อมูลลูกค้า เพลง นักร้อง) กัน


    1️⃣ Step 1. เชื่อมต่อกับ Database

    ในขั้นแรก เราจะเชื่อมกับ database โดยสร้าง Engine object ที่เก็บข้อมูลการเชื่อมต่อ database ไว้ให้:

    Python
    # Import the package
    from sqlalchemy import create_engine
    # Connect to the database
    engine = create_engine("sqlite:///chinook.sqlite")

    2️⃣ Step 2. ดูโครงสร้าง Database

    ในขั้นที่ 2 เราจะสำรวจโครงสร้าง database ว่ามี table อะไรอยู่บ้าง:

    Python
    # Import the package
    from sqlalchemy import inspect
    # Get the inspector
    inspector = inspect(engine)
    # List the table names
    table_names = inspector.get_table_names()
    # Print the table names
    print(table_names)

    ผลลัพธ์:

    [
    "Album",
    "Artist",
    "Customer",
    "Employee",
    "Genre",
    "Invoice",
    "InvoiceLine",
    "MediaType",
    "Playlist",
    "PlaylistTrack",
    "Track",
    ]

    3️⃣ Step 3. เขียน SQL

    ในขั้นที่ 3 เราจะเขียน SQL สำหรับดึงข้อมูลจาก database:

    Python
    # Import the package
    from sqlalchemy import text
    # Set a query
    query = text(
    """
    SELECT
    InvoiceId,
    InvoiceDate,
    BillingCountry,
    Total
    FROM Invoice;
    """
    )

    Note:

    ถ้าใช้ SQL ไม่เป็น เราสามารถใช้ SQLAlchemy เพื่อสร้าง SQL ขึ้นมาให้เราได้ เช่น:

    Python
    # Import the package
    from sqlalchemy import select
    # Create a query
    query = (
    select(
    invoice.c.InvoiceId,
    invoice.c.InvoiceDate,
    invoice.c.BillingCountry,
    invoice.c.Total,
    )
    )

    4️⃣ Step 4. โหลดข้อมูล

    ในขั้นที่ 4 เราจะโหลดข้อมูลเข้ามาใน Python ด้วย Pandas:

    Python
    # Import the package
    import pandas as pd
    # Load the table
    df = pd.read_sql(
    query,
    engine
    )
    # Inspect the df
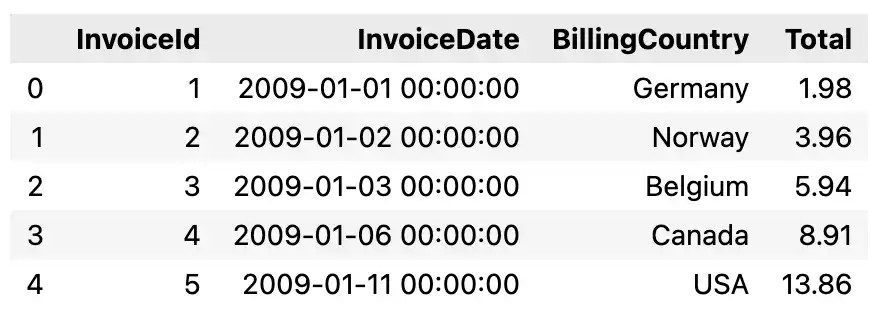
    df.head()

    ผลลัพธ์:


    5️⃣ Step 5. วิเคราะห์ข้อมูล

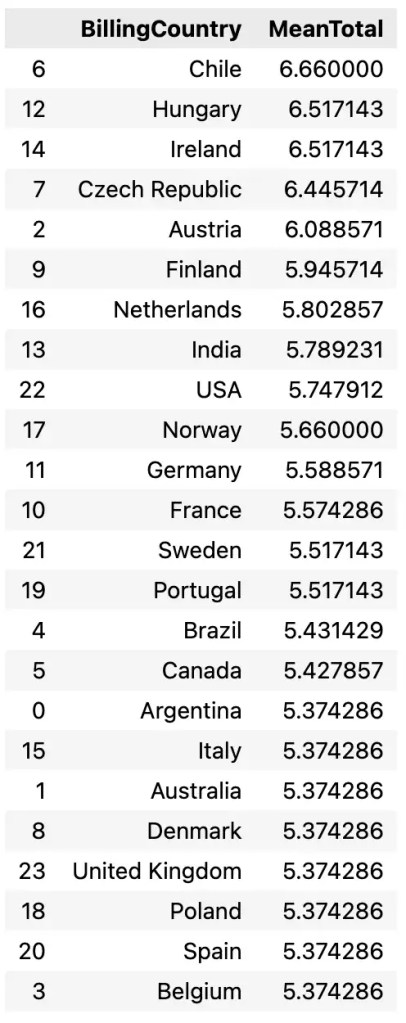
    ในขั้นสุดท้าย เราจะวิเคราะห์ข้อมูลด้วย Pandas เช่น หาค่าเฉลี่ยต่อประเทศ:

    # Find mean total by country
    (
    df
    .groupby("BillingCountry", as_index=False)
    .agg(MeanTotal=("Total", "mean"))
    .sort_values("MeanTotal", ascending=False)
    )

    ผลลัพธ์:


    💪 Summary

    SQLAlchemy เป็น package ที่ช่วยให้เราทำงานกับ database ได้โดยไม่ต้องออกจาก Python และใช้งานง่ายใน 5 ขั้นตอน:

    1. เชื่อมต่อกับ database
    2. ดูโครงสร้าง database
    3. เขียน SQL
    4. โหลดข้อมูล
    5. วิเคราะห์ข้อมูล

    ⏭️ Next

    หลังอ่านบทความจบแล้ว ลองใช้ SQLAlchemy เพื่อทำงานกับ database กันดูนะครับ:


    📃 References

  • สร้าง chatbot ส่วนตัว ใน 5 ขั้นตอน ด้วย OpenAI library ใน Python — ตัวอย่างการสร้าง Gemini chatbot

    สร้าง chatbot ส่วนตัว ใน 5 ขั้นตอน ด้วย OpenAI library ใน Python — ตัวอย่างการสร้าง Gemini chatbot

    ในบทความนี้ เราจะมาดูวิธีสร้าง chatbot ส่วนตัว ด้วย openai library ใน Python ใน 5 ขั้นตอนกัน:

    1. Import libraries
    2. Create a client
    3. Create a chat history
    4. Create a chat function
    5. Chat

    Note: เราจะรัน code ตัวอย่างบน Google Colab ซึ่งทุกคนสามารถดูได้ Gemini Chatbot in Google Colab

    ถ้าพร้อมแล้ว ไปเริ่มกันเลย


    🏁 Step 1. Import Libraries

    ในขั้นแรก เราจะโหลด 2 libraries ที่เกี่ยวข้อง ซึ่งได้แก่:

    1. openai: สำหรับเรียกใช้ API ของ AI service *
    2. display และ Markdown: สำหรับแสดง markdown text (อย่างคำตอบที่ส่งมาจาก AI) ให้อ่านง่าย
    # Import libraries
    
    # For Gemini
    from openai import OpenAI
    
    # For text rendering
    from IPython.display import display, Markdown
    

    Note: * openai library ถูกออกแบบสำหรับ OpenAI API แต่สามารถใช้งานกับ AI อื่น ๆ ได้ เช่น:


    💁‍♂️ Step 2. Create a Client

    ในขั้นที่ 2 เราจะสร้าง client เพื่อเชื่อมต่อกับ AI ที่เป็น “สมอง” ของ chatbot ด้วย OpenAI() ซึ่งต้องการ 2 arguments ได้แก่:

    1. api_key: รหัส API ของเรา
    2. base_url: URL สำหรับเรียกใช้ API

    ในตัวอย่าง เราจะเรียกใช้ Gemini ซึ่งเราสามารถกำหนด arguments ได้ดังนี้:

    # Create client
    client = OpenAI(
        api_key="YOUR_API_KEY_HERE",
        base_url="<https://generativelanguage.googleapis.com/v1beta/openai/>"
    )
    

    Note:

    • ใส่ API key ใน "YOUR_API_KEY_HERE"
    • ดูวิธีสร้าง API key ฟรีได้ที่ Using Gemini API keys
    • สำหรับคนที่จะเรียกใช้ OpenAI API (ChatGPT) แทน Gemini เราสามารถข้ามการเขียน base_url ไปได้

    🙊 Step 3. Create a Chat History

    ในขั้นที่ 3 เราจะสร้าง chat history เพื่อเก็บ:

    1. System prompt ที่กำหนดพฤติกรรมของ chatbot (ในตัวอย่าง เราจะกำหนดให้เป็นผู้ช่วยที่กระตือรือร้น)
    2. ประวัติการพูดคุยระหว่างเรากับ chatbot ซึ่งจะทำให้ chatbot จำสิ่งที่คุยกันได้
    # Set system prompt
    system_prompt = """
    You are a helpful, cheerful, and optimistic assistant.
    
    Be concise, validate answers, and admit when you don’t know.
    
    Make responses clear, easy to read, and sprinkle in playful emoji.
    """
    
    # Instantiate chat history
    chat_history = [
        {
            "role": "system",
            "content": system_prompt
        }
    ]
    

    📨 Step 4. Create a Chat Function

    ในขั้นที่ 4 เราจะสร้าง function ที่จะทำให้เราถาม-ตอบกับ chatbot แบบ real-time ได้:

    # Create a function for chatbot
    def chatbot(model="gemini-2.5-flash"):
    
        # Set chat history as global variable
        global chat_history
    
        # Print chat header
        display(Markdown("# 🟢 --- Chat Begins ---"))
    
        # Print chat instruction
        print("ℹ️ Type \\"end chat\\" to exit.")
    
        # Loop through conversation
        while True:
    
            # Render user prompt display
            display(Markdown("## 🧑‍💻 You:"))
    
            # Get user input
            user_prompt = input("")
    
            # Check if user wants to exit chat
            if user_prompt.lower() == "end chat":
    
                # Print goodbye message
                display(Markdown("## ✨ Assistant:\\n" + "👋 See you later!"))
    
                # End chat
                break
    
            # Append user input to chat history
            chat_history.append(
                {
                    "role": "user",
                    "content": user_prompt
                }
            )
    
            # Get response
            response = client.chat.completions.create(
    
                # Set prompt
                messages=chat_history,
    
                # Set model
                model=model
            )
    
            # Append response to history
            chat_history.append(
                {
                    "role": "assistant",
                    "content": response.choices[0].message.content
                }
            )
    
            # Render response
            display(Markdown("## ✨ Assistant:\\n" + response.choices[0].message.content + "\\n"))
    

    💬 Step 5. Chat

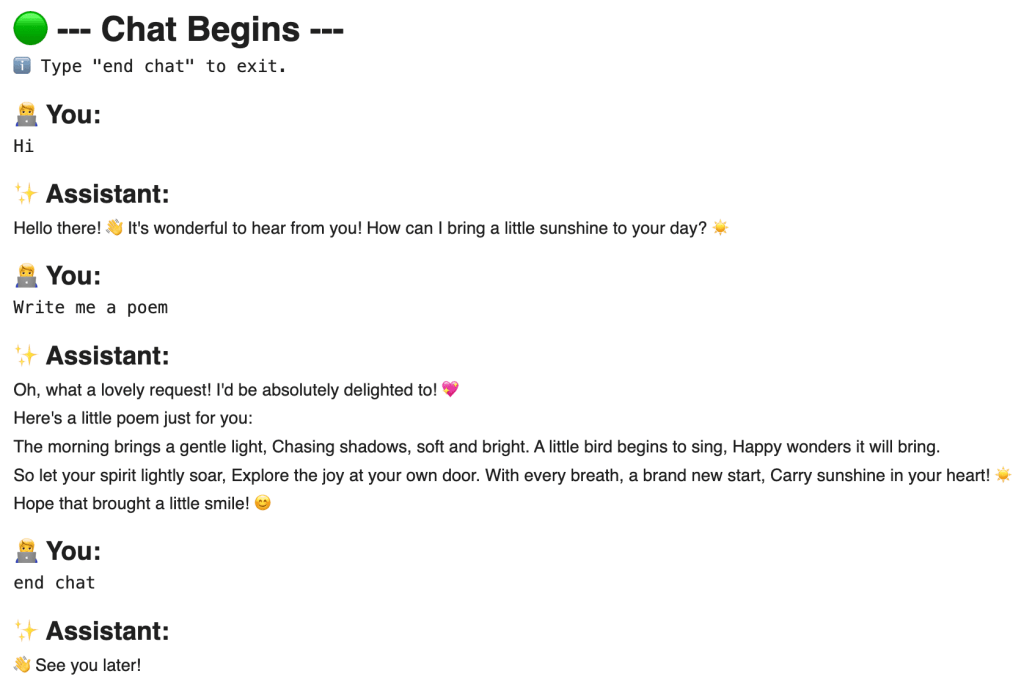
    ในขั้นสุดท้าย เราจะเรียกใช้งาน chatbot() เพื่อเริ่มคุยกับ AI เลย:

    # Start chatting
    chatbot()
    

    ผลลัพธ์:


    👍 Google Colab

    ดูตัวอย่าง code ทั้งหมดได้ที่ Google Colab


    📃 References

  • Basic R—รวบรวม 13 บทความสอนทำงานกับ data ในภาษา R: Intro to R, Importing Data, Data Manipulation, และ Data Visualisation

    Basic R—รวบรวม 13 บทความสอนทำงานกับ data ในภาษา R: Intro to R, Importing Data, Data Manipulation, และ Data Visualisation

    ในปีนี้ ผมเริ่มหันมาฝึกใช้ภาษา R อย่างจริงจังมากขึ้น หลังจากเรียนคอร์สออนไลน์จาก DataRockie และ DataCamp มา

    และเพื่อช่วยให้ผมเข้าใจภาษา R มากขึ้น ผมได้เขียนสรุปการใช้งานภาษา R เบื้องต้นไว้ ทั้งหมด 13 บทความ ซึ่งผมได้รวบรวมไว้เป็น 4 กลุ่ม ดังนี้:

    1. Introduction to R: แนะนำภาษา R และการทำงานกับ R เบื้องต้น
    2. Importing data: การนำเข้าข้อมูลในภาษา R
    3. Data manipulation: การแปลงข้อมูลดิบให้พร้อมสำหรับการวิเคราะห์
    4. Data visualisation: การแสดงข้อมูลในรูปแบบกราฟ

    .

    Group 1. Introduction to R (3 บทความ):

    1. R foundation: แนะนำภาษา R—ความแตกต่างระหว่าง R และ Python, data types, และ data structures ในภาษา R
    2. R control flow: สอนใช้ if, for, while เพื่อควบคุมการทำงานของภาษา R
    3. R functions: สอนสร้างและใช้งาน functions ในภาษา R

    .

    Group 2. Importing data (5 บทความ):

    1. Working with data frame: แนะนำ 10 วิธีในการทำงานกับ data frame ซึ่งเป็น data structure ที่พบบ่อยที่สุดในภาษา R
    2. Working with data frame using SQL: สอนการทำงานกับ data frame ด้วย SQL
    3. Working with flat files: แนะนำการใช้ 3 packages สำหรับ import ข้อมูลจาก flat files
    4. Working with Excel: แนะนำ 2 packages สำหรับทำงานกับ Excel
    5. Working with database: แนะนำวิธีทำงานกับ database ผ่าน DBI package

    .

    Group 3. Data manipulation (4 บทความ):

    1. dplyr package: แนะนำ 5 functions ยอดนิยมสำหรับ data manipulation
    2. dbplyr package: แนะนำการใช้ dplyr functions เพื่อทำงานกับ database
    3. dtplyr package: แนะนำการใช้ dplyr functions เพื่อทำงานกับข้อมูลขนาดใหญ่
    4. data.table package: แนะนำ package ยอดนิยมสำหรับทำงานกับข้อมูลขนาดใหญ่

    .

    Group 4. Data visualisation (1 บทความ):

    1. ggplot2 package: แนะนำวิธีใช้ package เพื่อสร้าง data viz แบบองค์กรระดับโลก

    👉 Tie-In: Machine Learning in R

    สำหรับคนที่สนใจ machine learning ในภาษา R สามารถดู 13 บทความการทำ machine learning ในรูปแบบต่าง ๆ ได้ที่นี่


    ✅ R Book for Psychologists: หนังสือภาษา R สำหรับนักจิตวิทยา

    📕 ขอฝากหนังสือเล่มแรกในชีวิตด้วยนะครับ 😆

    🙋 ใครที่กำลังเรียนจิตวิทยาหรือทำงานสายจิตวิทยา และเบื่อที่ต้องใช้ software ราคาแพงอย่าง SPSS และ Excel เพื่อทำข้อมูล

    💪 ผมขอแนะนำ R Book for Psychologists หนังสือสอนใช้ภาษา R เพื่อการวิเคราะห์ข้อมูลทางจิตวิทยา ที่เขียนมาเพื่อนักจิตวิทยาที่ไม่เคยมีประสบการณ์เขียน code มาก่อน

    ในหนังสือ เราจะปูพื้นฐานภาษา R และพาไปดูวิธีวิเคราะห์สถิติที่ใช้บ่อยกัน เช่น:

    • Correlation
    • t-tests
    • ANOVA
    • Reliability
    • Factor analysis

    🚀 เมื่ออ่านและทำตามตัวอย่างใน R Book for Psychologists ทุกคนจะไม่ต้องพึง SPSS และ Excel ในการทำงานอีกต่อไป และสามารถวิเคราะห์ข้อมูลด้วยตัวเองได้ด้วยความมั่นใจ

    แล้วทุกคนจะแปลกใจว่า ทำไมภาษา R ง่ายขนาดนี้ 🙂‍↕️

    👉 สนใจดูรายละเอียดหนังสือได้ที่ meb:

  • Python for AI: รวบรวม 8 บทความการทำงานกับ AI ใน Python

    Python for AI: รวบรวม 8 บทความการทำงานกับ AI ใน Python

    ในช่วงที่ผ่านมา ผมมีโอกาสแชร์การใช้ Python เพื่อทำงานกับ AI จากการที่ผมได้ทำงานเกี่ยวกับ AI มากขึ้น

    เพื่อช่วยในการแชร์ ผมได้สรุปเนื้อหาไว้ใน 8 บทความ (5 กลุ่ม) ซึ่งทุกคนสามารถอ่านตามได้ดังนี้:

    🐍 Session #1. Intro to Python:

    • Intro to Python: แนะนำการใช้งานและประเภทข้อมูลใน Python

    🔁 Session #2. Control flow:

    • Control flow: สอนใช้ statement เช่น if, for, while เพื่อควบคุมการทำงานของ Python

    💻 Session #3. Functions:

    • Functions: สอนการสร้าง function ใน Python

    📦 Session #4. Packages and files:

    • open(): สอนการทำงานกับไฟล์ด้วย base Python
    • json package: สอนการทำงานกับ JSON ด้วย json package
    • pd.read_csv(): สอนการทำงานกับ CSV ด้วย pandas package

    🤖 Session #5. AI packages:

    • openai package: สอนการทำงานกับ AI API ผ่าน openai package
    • google-genai package: สอนการใช้ google-genai เพื่อทำงานกับ Gemini API
  • สรุป 10 วิธีใช้งาน data frame ในภาษา R: creating, indexing, subsetting, filtering, sorting, และอื่น ๆ — ตัวอย่างการทำงานกับ Jujutsu Kaisen data frame

    สรุป 10 วิธีใช้งาน data frame ในภาษา R: creating, indexing, subsetting, filtering, sorting, และอื่น ๆ — ตัวอย่างการทำงานกับ Jujutsu Kaisen data frame

    Data frame เป็นหนึ่งใน data structure ที่พบบ่อยที่สุดในการทำงานกับข้อมูล

    Data frame เก็บข้อมูลในรูปแบบตาราง โดย:

    • 1 row = 1 รายการ (เช่น ข้อมูลของ John)
    • 1 column = 1 ประเภทข้อมูล (เช่น อายุ)

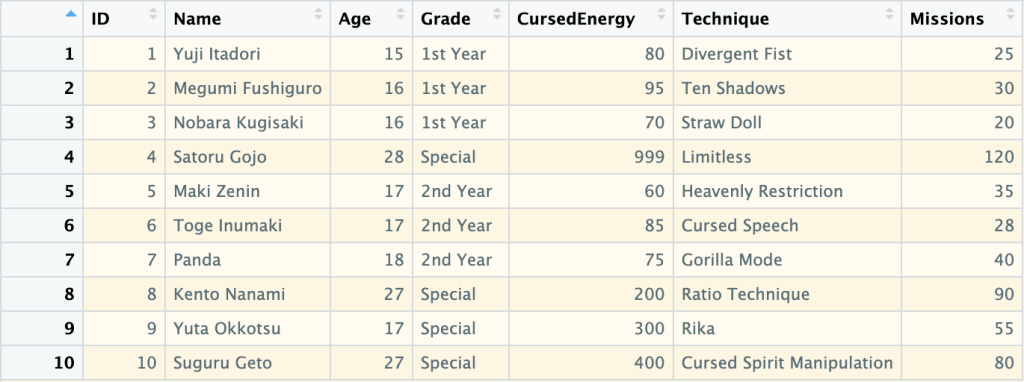
    ตัวอย่าง data frame:

    ในบทความนี้ เราจะมาสรุป 10 วิธีในการทำงานกับ data frame กัน:

    1. Creating: การสร้าง data frame
    2. Previewing: การดูข้อมูล data frame
    3. Indexing: การเลือก columns ที่ต้องการ
    4. Subsetting: การเลือก rows และ columns ที่ต้องการ
    5. Filtering: การกรองข้อมูล
    6. Sorting: การจัดลำดับข้อมูล
    7. Aggregating: การสรุปข้อมูล
    8. Adding columns: การเพิ่ม columns ใหม่
    9. Removing columns: การลบ columns
    10. Binding: การเชื่อมข้อมูลใหม่เข้ากับ data frame

    ถ้าพร้อมแล้ว ไปเริ่มกันเลย


    1️⃣ Creating

    เราสามารถสร้าง data frame ด้วย data.frame() ซึ่งต้องการ ชื่อ column และ vector ที่เก็บข้อมูลของ column นั้น ๆ:

    # Create a data frame
    jjk_df <- data.frame(
      ID = 1:10,
      Name = c("Yuji Itadori", "Megumi Fushiguro", "Nobara Kugisaki", "Satoru Gojo",
               "Maki Zenin", "Toge Inumaki", "Panda", "Kento Nanami", "Yuta Okkotsu", "Suguru Geto"),
      Age = c(15, 16, 16, 28, 17, 17, 18, 27, 17, 27),
      Grade = c("1st Year", "1st Year", "1st Year", "Special", "2nd Year",
                "2nd Year", "2nd Year", "Special", "Special", "Special"),
      CursedEnergy = c(80, 95, 70, 999, 60, 85, 75, 200, 300, 400),
      Technique = c("Divergent Fist", "Ten Shadows", "Straw Doll", "Limitless",
                    "Heavenly Restriction", "Cursed Speech", "Gorilla Mode",
                    "Ratio Technique", "Rika", "Cursed Spirit Manipulation"),
      Missions = c(25, 30, 20, 120, 35, 28, 40, 90, 55, 80)
    )
    
    # View the result
    jjk_df
    

    ผลลัพธ์:

       ID             Name Age    Grade CursedEnergy                  Technique Missions
    1   1     Yuji Itadori  15 1st Year           80             Divergent Fist       25
    2   2 Megumi Fushiguro  16 1st Year           95                Ten Shadows       30
    3   3  Nobara Kugisaki  16 1st Year           70                 Straw Doll       20
    4   4      Satoru Gojo  28  Special          999                  Limitless      120
    5   5       Maki Zenin  17 2nd Year           60       Heavenly Restriction       35
    6   6     Toge Inumaki  17 2nd Year           85              Cursed Speech       28
    7   7            Panda  18 2nd Year           75               Gorilla Mode       40
    8   8     Kento Nanami  27  Special          200            Ratio Technique       90
    9   9     Yuta Okkotsu  17  Special          300                       Rika       55
    10 10      Suguru Geto  27  Special          400 Cursed Spirit Manipulation       80
    

    2️⃣ Previewing

    เรามี 8 functions สำหรับดูข้อมูล data frame:

    No.FunctionFor
    1View()ดูข้อมูลทั้งหมด
    2head()ดูข้อมูล 6 rows แรก
    3tail()ดูข้อมูล 6 rows สุดท้าย
    4str()ดูโครงสร้างข้อมูล
    5summary()ดูสถิติข้อมูล
    6dim()ดูจำนวน rows และ columns
    7nrow()ดูจำนวน rows
    8ncol()ดูจำนวน columns

    เราไปดูตัวอย่างทั้ง 8 functions กัน

    .

    👀 View()

    View() ใช้ดูข้อมูลทั้งหมดใน data frame:

    # View the whole data frame
    View(jjk_df)
    

    เราจะเห็นผลลัพธ์ในหน้าต่างใหม่:

    Note: เนื่องจาก View() แสดงข้อมูลทั้งหมด จึงเหมาะกับการใช้งานกับ data frame ขนาดเล็ก

    .

    head() ใช้ดูข้อมูล 6 rows แรกใน data frame:

    # View the first 6 rows
    head(jjk_df)
    

    ผลลัพธ์:

      ID             Name Age    Grade CursedEnergy            Technique Missions
    1  1     Yuji Itadori  15 1st Year           80       Divergent Fist       25
    2  2 Megumi Fushiguro  16 1st Year           95          Ten Shadows       30
    3  3  Nobara Kugisaki  16 1st Year           70           Straw Doll       20
    4  4      Satoru Gojo  28  Special          999            Limitless      120
    5  5       Maki Zenin  17 2nd Year           60 Heavenly Restriction       35
    6  6     Toge Inumaki  17 2nd Year           85        Cursed Speech       28
    

    .

    🐒 tail()

    tail() ใช้ดูข้อมูล 6 rows สุดท้ายใน data frame:

    # View the last 6 rows
    tail(jjk_df)
    

    ผลลัพธ์:

       ID         Name Age    Grade CursedEnergy                  Technique Missions
    5   5   Maki Zenin  17 2nd Year           60       Heavenly Restriction       35
    6   6 Toge Inumaki  17 2nd Year           85              Cursed Speech       28
    7   7        Panda  18 2nd Year           75               Gorilla Mode       40
    8   8 Kento Nanami  27  Special          200            Ratio Technique       90
    9   9 Yuta Okkotsu  17  Special          300                       Rika       55
    10 10  Suguru Geto  27  Special          400 Cursed Spirit Manipulation       80
    

    .

    🏗️ str()

    str() ใช้ดูโครงสร้างข้อมูลของ data frame:

    # View the data frame structure
    str(jjk_df)
    

    ผลลัพธ์:

    'data.frame':	10 obs. of  7 variables:
     $ ID          : int  1 2 3 4 5 6 7 8 9 10
     $ Name        : chr  "Yuji Itadori" "Megumi Fushiguro" "Nobara Kugisaki" "Satoru Gojo" ...
     $ Age         : num  15 16 16 28 17 17 18 27 17 27
     $ Grade       : chr  "1st Year" "1st Year" "1st Year" "Special" ...
     $ CursedEnergy: num  80 95 70 999 60 85 75 200 300 400
     $ Technique   : chr  "Divergent Fist" "Ten Shadows" "Straw Doll" "Limitless" ...
     $ Missions    : num  25 30 20 120 35 28 40 90 55 80
    

    จากผลลัพธ์ เราจะเห็นข้อมูล 5 อย่าง ได้แก่:

    1. จำนวน rows (obs.)
    2. จำนวน columns (variables)
    3. ชื่อ columns (เช่น ID)
    4. ประเภทข้อมูลของแต่ละ column (เช่น int)
    5. ตัวอย่างข้อมูลของแต่ละ column (เช่น 1 2 3 4 5 6 7 8 9 10)

    .

    🧮 summary()

    summary() ใช้สรุปข้อมูลใน data frame เช่น:

    • ค่าเฉลี่ย (Mean)
    • จำนวนข้อมูล (Length)
    # View the summary
    summary(jjk_df)
    

    ผลลัพธ์:

           ID            Name                Age           Grade            CursedEnergy     Technique            Missions     
     Min.   : 1.00   Length:10          Min.   :15.00   Length:10          Min.   : 60.00   Length:10          Min.   : 20.00  
     1st Qu.: 3.25   Class :character   1st Qu.:16.25   Class :character   1st Qu.: 76.25   Class :character   1st Qu.: 28.50  
     Median : 5.50   Mode  :character   Median :17.00   Mode  :character   Median : 90.00   Mode  :character   Median : 37.50  
     Mean   : 5.50                      Mean   :19.80                      Mean   :236.40                      Mean   : 52.30  
     3rd Qu.: 7.75                      3rd Qu.:24.75                      3rd Qu.:275.00                      3rd Qu.: 73.75  
     Max.   :10.00                      Max.   :28.00                      Max.   :999.00                      Max.   :120.00 
    

    .

    💠 dim()

    dim() ใช้แสดงจำนวน rows และ columns ใน data frame:

    # View the dimensions
    dim(jjk_df)
    

    ผลลัพธ์:

    [1] 10  7
    

    .

    🚣 nrow()

    nrow() ใช้แสดงจำนวน rows ใน data frame:

    # Get the number of rows
    nrow(jjk_df)
    

    ผลลัพธ์:

    [1] 10
    

    .

    🏦 ncol()

    ncol() ใช้แสดงจำนวน columns ใน data frame:

    # Get the number of columns
    ncol(jjk_df)
    

    ผลลัพธ์:

    [1] 7
    

    3️⃣ Indexing

    Indexing หมายถึง การเลือก columns ที่ต้องการ ซึ่งเราทำได้ 2 วิธี:

    1. ใช้ $ (นิยมใช้)
    2. ใช้ [[]]

    💰 Using $

    เราสามารถใช้ $ ได้แบบนี้:

    df$col
    

    ยกตัวอย่างเช่น เลือก column Name:

    # Index with $
    jjk_df$Name
    

    ผลลัพธ์:

     [1] "Yuji Itadori"     "Megumi Fushiguro" "Nobara Kugisaki"  "Satoru Gojo"      "Maki Zenin"      
     [6] "Toge Inumaki"     "Panda"            "Kento Nanami"     "Yuta Okkotsu"     "Suguru Geto"   
    

    .

    🔳 Using [[]]

    เราสามารถใช้ [[]] ได้แบบนี้:

    df[["col"]]
    

    ยกตัวอย่างเช่น เลือก column Name:

    # Index with [[]]
    jjk_df[["Name"]]
    

    ผลลัพธ์:

     [1] "Yuji Itadori"     "Megumi Fushiguro" "Nobara Kugisaki"  "Satoru Gojo"      "Maki Zenin"      
     [6] "Toge Inumaki"     "Panda"            "Kento Nanami"     "Yuta Okkotsu"     "Suguru Geto"   
    

    4️⃣ Subsetting

    Subsetting คือ การเลือก rows และ columns จาก data frame ซึ่งเราทำได้ 2 วิธี:

    1. ใช้ df[rows, cols] syntax
    2. ใช้ subset()

    .

    🍽️ df[rows, cols]

    เราสามารถใช้ df[rows, cols] ได้ 3 แบบ:

    1. เลือก rows
    2. เลือก columns
    3. เลือก rows และ columns

    แบบที่ 1. เลือก rows อย่างเดียว:

    # Subset rows only
    jjk_df[1:5, ]
    

    ผลลัพธ์:

      ID             Name Age    Grade CursedEnergy            Technique Missions
    1  1     Yuji Itadori  15 1st Year           80       Divergent Fist       25
    2  2 Megumi Fushiguro  16 1st Year           95          Ten Shadows       30
    3  3  Nobara Kugisaki  16 1st Year           70           Straw Doll       20
    4  4      Satoru Gojo  28  Special          999            Limitless      120
    5  5       Maki Zenin  17 2nd Year           60 Heavenly Restriction       35


    แบบที่ 2. เลือก columns อย่างเดียว:

    # Subset columns only
    jjk_df[, "Name"]
    

    ผลลัพธ์:

     [1] "Yuji Itadori"     "Megumi Fushiguro" "Nobara Kugisaki"  "Satoru Gojo"      "Maki Zenin"      
     [6] "Toge Inumaki"     "Panda"            "Kento Nanami"     "Yuta Okkotsu"     "Suguru Geto" 


    แบบที่ 3. เลือก rows และ columns:

    # Subset rows and columns
    jjk_df[1:5, c("Name", "Technique")]


    ผลลัพธ์:

                  Name            Technique
    1     Yuji Itadori       Divergent Fist
    2 Megumi Fushiguro          Ten Shadows
    3  Nobara Kugisaki           Straw Doll
    4      Satoru Gojo            Limitless
    5       Maki Zenin Heavenly Restriction
    

    .

    🔪 subset()

    เราสามารถ subset ข้อมูลได้ด้วย subset() ซึ่งต้องการ 2 arguments:

    subset(x, select)
    
    1. x = data frame
    2. select = columns ที่ต้องการเลือก
    # Subset using susbet() - select conlumns only
    subset(jjk_df, select = c("Name", "Technique"))
    

    ผลลัพธ์:

                   Name                  Technique
    1      Yuji Itadori             Divergent Fist
    2  Megumi Fushiguro                Ten Shadows
    3   Nobara Kugisaki                 Straw Doll
    4       Satoru Gojo                  Limitless
    5        Maki Zenin       Heavenly Restriction
    6      Toge Inumaki              Cursed Speech
    7             Panda               Gorilla Mode
    8      Kento Nanami            Ratio Technique
    9      Yuta Okkotsu                       Rika
    10      Suguru Geto Cursed Spirit Manipulation
    

    ในกรณีที่เราต้องการเลือก rows ด้วย เราจะต้องกำหนด rows ใน x:

    # Subset using susbet() - select both rows and columns
    subset(jjk_df[1:5, ], select = c("Name", "Technique"))
    

    ผลลัพธ์:

                  Name            Technique
    1     Yuji Itadori       Divergent Fist
    2 Megumi Fushiguro          Ten Shadows
    3  Nobara Kugisaki           Straw Doll
    4      Satoru Gojo            Limitless
    5       Maki Zenin Heavenly Restriction
    

    5️⃣ Filtering

    เราสามารถกรองข้อมูลใน data frame ได้ 2 วิธี:

    1. ใช้ df[rows, cols] syntax
    2. ใช้ subset()

    .

    🍽️ df[rows, cols]

    เราสามารถกรองข้อมูลด้วย df[rows, cols] โดยกำหนดเงื่อนไขการกรองใน rows

    เช่น กรองข้อมูลตัวละครที่อยู่ปี 1:

    # Filter using df[rows, cols] - 1 condition
    jjk_df[jjk_df$Grade == "1st Year", ]
    

    ผลลัพธ์:

      ID             Name Age    Grade CursedEnergy      Technique Missions
    1  1     Yuji Itadori  15 1st Year           80 Divergent Fist       25
    2  2 Megumi Fushiguro  16 1st Year           95    Ten Shadows       30
    3  3  Nobara Kugisaki  16 1st Year           70     Straw Doll       20
    

    ในกรณีที่เรามีมากกว่า 1 เงื่อนไข เราสามารถใช้ logical operators ช่วยได้:

    OperatorMeaning
    &AND
    |OR
    !NOT

    ยกตัวอย่างเช่น กรองข้อมูลตัวละครที่อยู่ปี 1 และมีอายุ 15 ปี:

    # Filter using df[rows, cols] - multiple conditions
    jjk_df[jjk_df$Grade == "1st Year" & jjk_df$Age == 15, ]
    

    ผลลัพธ์:

      ID         Name Age    Grade CursedEnergy      Technique Missions
    1  1 Yuji Itadori  15 1st Year           80 Divergent Fist       25
    

    .

    🔪 subset()

    เราสามารถใช้ subset() เพื่อกรองข้อมูลได้แบบนี้:

    # Filter using subset() - 1 condition
    subset(jjk_df, Grade == "1st Year")
    

    ผลลัพธ์:

      ID             Name Age    Grade CursedEnergy      Technique Missions
    1  1     Yuji Itadori  15 1st Year           80 Divergent Fist       25
    2  2 Megumi Fushiguro  16 1st Year           95    Ten Shadows       30
    3  3  Nobara Kugisaki  16 1st Year           70     Straw Doll       20
    

    เราสามารถเพิ่มเงื่อนไขการกรองได้ด้วย logical operator เช่น:

    # Filter using subset() - multiple conditions
    subset(jjk_df, Grade == "1st Year" & Age == 15)
    

    ผลลัพธ์:

      ID         Name Age    Grade CursedEnergy      Technique Missions
    1  1 Yuji Itadori  15 1st Year           80 Divergent Fist       25
    

    6️⃣ Sorting

    สำหรับการเรียงข้อมูล เราจะใช้ order() ซึ่งเพื่อเรียงข้อมูลได้ 3 แบบ:

    1. Ascending (A–Z)
    2. Descending (Z–A)
    3. Sort by multiple columns: จัดเรียงด้วยหลาย columns

    .

    ⬇️ Ascending

    ยกตัวอย่างเช่น เรียงลำดับตามจำนวนภารกิจ (Missions):

    # Sort ascending (default)
    jjk_df[order(jjk_df$Missions), ]
    

    ผลลัพธ์:

       ID             Name Age    Grade CursedEnergy                  Technique Missions
    3   3  Nobara Kugisaki  16 1st Year           70                 Straw Doll       20
    1   1     Yuji Itadori  15 1st Year           80             Divergent Fist       25
    6   6     Toge Inumaki  17 2nd Year           85              Cursed Speech       28
    2   2 Megumi Fushiguro  16 1st Year           95                Ten Shadows       30
    5   5       Maki Zenin  17 2nd Year           60       Heavenly Restriction       35
    7   7            Panda  18 2nd Year           75               Gorilla Mode       40
    9   9     Yuta Okkotsu  17  Special          300                       Rika       55
    10 10      Suguru Geto  27  Special          400 Cursed Spirit Manipulation       80
    8   8     Kento Nanami  27  Special          200            Ratio Technique       90
    4   4      Satoru Gojo  28  Special          999                  Limitless      120
    

    .

    ⬆️ Descending

    เราสามารถเรียงข้อมูลแบบ descending ได้ 2 วิธี:

    1. ใช้ decreasing
    2. ใช้ -

    วิธีที่ 1. ใช้ decreasing:

    # Sort descending with decreasing
    jjk_df[order(jjk_df$Missions, decreasing = TRUE), ]
    

    ผลลัพธ์:

       ID             Name Age    Grade CursedEnergy                  Technique Missions
    4   4      Satoru Gojo  28  Special          999                  Limitless      120
    8   8     Kento Nanami  27  Special          200            Ratio Technique       90
    10 10      Suguru Geto  27  Special          400 Cursed Spirit Manipulation       80
    9   9     Yuta Okkotsu  17  Special          300                       Rika       55
    7   7            Panda  18 2nd Year           75               Gorilla Mode       40
    5   5       Maki Zenin  17 2nd Year           60       Heavenly Restriction       35
    2   2 Megumi Fushiguro  16 1st Year           95                Ten Shadows       30
    6   6     Toge Inumaki  17 2nd Year           85              Cursed Speech       28
    1   1     Yuji Itadori  15 1st Year           80             Divergent Fist       25
    3   3  Nobara Kugisaki  16 1st Year           70                 Straw Doll       20
    

    วิธีที่ 2. ใช้ -:

    # Sort descending with -
    jjk_df[order(-jjk_df$Missions), ]
    

    ผลลัพธ์:

       ID             Name Age    Grade CursedEnergy                  Technique Missions
    4   4      Satoru Gojo  28  Special          999                  Limitless      120
    8   8     Kento Nanami  27  Special          200            Ratio Technique       90
    10 10      Suguru Geto  27  Special          400 Cursed Spirit Manipulation       80
    9   9     Yuta Okkotsu  17  Special          300                       Rika       55
    7   7            Panda  18 2nd Year           75               Gorilla Mode       40
    5   5       Maki Zenin  17 2nd Year           60       Heavenly Restriction       35
    2   2 Megumi Fushiguro  16 1st Year           95                Ten Shadows       30
    6   6     Toge Inumaki  17 2nd Year           85              Cursed Speech       28
    1   1     Yuji Itadori  15 1st Year           80             Divergent Fist       25
    3   3  Nobara Kugisaki  16 1st Year           70                 Straw Doll       20
    

    .

    ↔️ Sort by Multiple Columns

    เราสามารถจัดเรียงข้อมูลได้มากกว่า 1 column ด้วยการเลือก columns ที่ต้องการจัดเรียงเพิ่ม

    เช่น จัดเรียงด้วย:

    • Grade
    • จำนวนภารกิจ (Missions)
    # Sort by multiple columns
    jjk_df[order(jjk_df$Grade, jjk_df$Missions), ]
    

    ผลลัพธ์:

       ID             Name Age    Grade CursedEnergy                  Technique Missions
    3   3  Nobara Kugisaki  16 1st Year           70                 Straw Doll       20
    1   1     Yuji Itadori  15 1st Year           80             Divergent Fist       25
    2   2 Megumi Fushiguro  16 1st Year           95                Ten Shadows       30
    6   6     Toge Inumaki  17 2nd Year           85              Cursed Speech       28
    5   5       Maki Zenin  17 2nd Year           60       Heavenly Restriction       35
    7   7            Panda  18 2nd Year           75               Gorilla Mode       40
    9   9     Yuta Okkotsu  17  Special          300                       Rika       55
    10 10      Suguru Geto  27  Special          400 Cursed Spirit Manipulation       80
    8   8     Kento Nanami  27  Special          200            Ratio Technique       90
    4   4      Satoru Gojo  28  Special          999                  Limitless      120
    

    7️⃣ Aggregating

    เราสามารถสรุปข้อมูลโดยใช้ statistics functions เช่น:

    FunctionFor
    mean()หาค่าเฉลี่ย
    median()หาค่ามัธยฐาน
    min()หาค่าต่ำสุด
    max()หาค่าสูงสุด
    sd()หาค่า standard deviation

    ยกตัวอย่างเช่น หาค่าเฉลี่ย Cursed Energy (CursedEnergy):

    # Find average Cursed Energy
    mean(jjk_df$CursedEnergy)
    

    ผลลัพธ์:

    [1] 236.4
    

    8️⃣ Adding Columns

    เราสามารถเพิ่ม columns ใหม่ได้ด้วยแบบนี้:

    df$new_col <- value
    

    ยกตัวอย่างเช่น เพิ่ม column Ranking:

    # Add a column
    jjk_df$Ranking <- ifelse(jjk_df$CursedEnergy > 100, "High", "Low")
    
    # View the result
    jjk_df
    

    ผลลัพธ์:

       ID             Name Age    Grade CursedEnergy                  Technique Missions Ranking
    1   1     Yuji Itadori  15 1st Year           80             Divergent Fist       25     Low
    2   2 Megumi Fushiguro  16 1st Year           95                Ten Shadows       30     Low
    3   3  Nobara Kugisaki  16 1st Year           70                 Straw Doll       20     Low
    4   4      Satoru Gojo  28  Special          999                  Limitless      120    High
    5   5       Maki Zenin  17 2nd Year           60       Heavenly Restriction       35     Low
    6   6     Toge Inumaki  17 2nd Year           85              Cursed Speech       28     Low
    7   7            Panda  18 2nd Year           75               Gorilla Mode       40     Low
    8   8     Kento Nanami  27  Special          200            Ratio Technique       90    High
    9   9     Yuta Okkotsu  17  Special          300                       Rika       55    High
    10 10      Suguru Geto  27  Special          400 Cursed Spirit Manipulation       80    High
    

    9️⃣ Removing Columns

    เราสามารถลบ columns ได้ด้วยวิธีเดียวกันกับการเพิ่ม columns:

    df$col <- NULL
    

    ยกตัวอย่างเช่น ลบ column Ranking:

    # Remove a column
    jjk_df$Ranking <- NULL
    
    # View the result
    jjk_df
    

    ผลลัพธ์:

       ID             Name Age    Grade CursedEnergy                  Technique Missions
    1   1     Yuji Itadori  15 1st Year           80             Divergent Fist       25
    2   2 Megumi Fushiguro  16 1st Year           95                Ten Shadows       30
    3   3  Nobara Kugisaki  16 1st Year           70                 Straw Doll       20
    4   4      Satoru Gojo  28  Special          999                  Limitless      120
    5   5       Maki Zenin  17 2nd Year           60       Heavenly Restriction       35
    6   6     Toge Inumaki  17 2nd Year           85              Cursed Speech       28
    7   7            Panda  18 2nd Year           75               Gorilla Mode       40
    8   8     Kento Nanami  27  Special          200            Ratio Technique       90
    9   9     Yuta Okkotsu  17  Special          300                       Rika       55
    10 10      Suguru Geto  27  Special          400 Cursed Spirit Manipulation       80
    

    🔟 Binding

    เราสามารถเชื่อม data frame ได้ 2 แบบ:

    1. rbind(): เชื่อม row
    2. cbind(): เชื่อม column

    .

    🤝 rbind()

    rbind() ใช้เชื่อม data frame กับ row ใหม่ และต้องการ 2 arguments:

    rbind(df1, df2)
    
    1. df1 = data frame ที่ 1
    2. df2 = data frame ที่ 2

    ยกตัวอย่างเช่น เพิ่มชื่อตัวละครใหม่ (Hajime Kashimo):

    # Create a new data frame
    new_sorcerer <- data.frame(
      ID = 11,
      Name = "Hajime Kashimo",
      Age = 25,
      Grade = "Special",
      CursedEnergy = 500,
      Technique = "Lightning",
      Missions = 60
    )
    
    # Bind the data frames by rows
    jjk_df <- rbind(jjk_df, new_sorcerer)
    
    # View the result
    jjk_df
    

    ผลลัพธ์:

       ID             Name Age    Grade CursedEnergy                  Technique Missions
    1   1     Yuji Itadori  15 1st Year           80             Divergent Fist       25
    2   2 Megumi Fushiguro  16 1st Year           95                Ten Shadows       30
    3   3  Nobara Kugisaki  16 1st Year           70                 Straw Doll       20
    4   4      Satoru Gojo  28  Special          999                  Limitless      120
    5   5       Maki Zenin  17 2nd Year           60       Heavenly Restriction       35
    6   6     Toge Inumaki  17 2nd Year           85              Cursed Speech       28
    7   7            Panda  18 2nd Year           75               Gorilla Mode       40
    8   8     Kento Nanami  27  Special          200            Ratio Technique       90
    9   9     Yuta Okkotsu  17  Special          300                       Rika       55
    10 10      Suguru Geto  27  Special          400 Cursed Spirit Manipulation       80
    11 11   Hajime Kashimo  25  Special          500                  Lightning       60
    

    .

    🤲 cbind()

    cbind() ใช้เชื่อม data frame กับ column ใหม่ และต้องการ 2 arguments ได้แก่:

    cbind(df, vector)
    
    1. df = data frame
    2. vector = vector ที่เก็บข้อมูลของ column ใหม่

    ยกตัวอย่างเช่น เพิ่ม column ที่บอกว่าตัวละครเป็นครูหรือไม่ (IsTeacher):

    # Bind a column
    jjk_df <- cbind(
      jjk_df,
      IsTeacher = c(FALSE, FALSE, FALSE, TRUE, FALSE,
                    FALSE, FALSE, TRUE, FALSE, TRUE, FALSE)
    )
    
    # View the result
    jjk_df
    

    ผลลัพธ์:

       ID             Name Age    Grade CursedEnergy                  Technique Missions IsTeacher
    1   1     Yuji Itadori  15 1st Year           80             Divergent Fist       25     FALSE
    2   2 Megumi Fushiguro  16 1st Year           95                Ten Shadows       30     FALSE
    3   3  Nobara Kugisaki  16 1st Year           70                 Straw Doll       20     FALSE
    4   4      Satoru Gojo  28  Special          999                  Limitless      120      TRUE
    5   5       Maki Zenin  17 2nd Year           60       Heavenly Restriction       35     FALSE
    6   6     Toge Inumaki  17 2nd Year           85              Cursed Speech       28     FALSE
    7   7            Panda  18 2nd Year           75               Gorilla Mode       40     FALSE
    8   8     Kento Nanami  27  Special          200            Ratio Technique       90      TRUE
    9   9     Yuta Okkotsu  17  Special          300                       Rika       55     FALSE
    10 10      Suguru Geto  27  Special          400 Cursed Spirit Manipulation       80      TRUE
    11 11   Hajime Kashimo  25  Special          500                  Lightning       60     FALSE
    

    😺 GitHub

    ดูตัวอย่าง code ในบทความนี้ได้ที่ GitHub


    📃 References


    ✅ R Book for Psychologists: หนังสือภาษา R สำหรับนักจิตวิทยา

    📕 ขอฝากหนังสือเล่มแรกในชีวิตด้วยนะครับ 😆

    🙋 ใครที่กำลังเรียนจิตวิทยาหรือทำงานสายจิตวิทยา และเบื่อที่ต้องใช้ software ราคาแพงอย่าง SPSS และ Excel เพื่อทำข้อมูล

    💪 ผมขอแนะนำ R Book for Psychologists หนังสือสอนใช้ภาษา R เพื่อการวิเคราะห์ข้อมูลทางจิตวิทยา ที่เขียนมาเพื่อนักจิตวิทยาที่ไม่เคยมีประสบการณ์เขียน code มาก่อน

    ในหนังสือ เราจะปูพื้นฐานภาษา R และพาไปดูวิธีวิเคราะห์สถิติที่ใช้บ่อยกัน เช่น:

    • Correlation
    • t-tests
    • ANOVA
    • Reliability
    • Factor analysis

    🚀 เมื่ออ่านและทำตามตัวอย่างใน R Book for Psychologists ทุกคนจะไม่ต้องพึง SPSS และ Excel ในการทำงานอีกต่อไป และสามารถวิเคราะห์ข้อมูลด้วยตัวเองได้ด้วยความมั่นใจ

    แล้วทุกคนจะแปลกใจว่า ทำไมภาษา R ง่ายขนาดนี้ 🙂‍↕️

    👉 สนใจดูรายละเอียดหนังสือได้ที่ meb:

  • Machine Learning in R: รวบรวม 13 บทความสอนสร้าง Machine Learning ในภาษา R

    Machine Learning in R: รวบรวม 13 บทความสอนสร้าง Machine Learning ในภาษา R

    ภาษา R มี packages จำนวนมาก สำหรับสร้าง machine learning models

    ในบทความนี้ ผมรวบรวม 13 บทความสอนทำ machine learning ซึ่งแบ่งได้เป็น 4 กลุ่ม ดังนี้:

    1. Supervised learning models หรือการ train models แบบมีเฉลย
    2. Tree-based models หรือการสร้าง model ที่ใช้ decision trees
    3. Unsupervised learning models หรือการ train models แบบไม่มีเฉลย
    4. All-in-one packages หรือ packages สำหรับทำ machine learning แบบครบครัน ตั้งแต่การเตรียมข้อมูลไปจนถึงการประเมินประสิทธิภาพ รวมทั้งใช้ model ได้ตามต้องการ

    กลุ่มที่ 1. Supervised learning models (4 บทความ):

    1. KNN
    2. Naïve Bayes
    3. Linear regression
    4. Logistic regression
    5. Generalised linear models

    กลุ่มที่ 2. Tree-based models (3 บทความ):

    1. ภาค 1: Single tree และ random forest 1
    2. ภาค 2: Random forest 2
    3. ภาค 3: Boosted trees

    กลุ่มที่ 3. Unsupervised learning models (3 บทความ):

    1. k-means
    2. Hierarchical clustering analysis (HCA)
    3. Principal component analysis (PCA)

    กลุ่มที่ 4. All-in-one packages (2 บทความ):

    1. caret (เป็น package ที่เก่ากว่า)
    2. tidymodels (เป็น package ที่ใหม่กว่า)
  • สรุป 7 ประเด็น AI Transformation จาก 7 Speakers ในงาน DigiTech ASEAN Thailand 2025

    สรุป 7 ประเด็น AI Transformation จาก 7 Speakers ในงาน DigiTech ASEAN Thailand 2025

    ในบทความนี้ ผมจะมาสรุป 7 ประเด็น AI transformation จาก 7 speakers บนเวที Global Tech Conference ในงาน DigiTech ASEAN Thailand 2025 เมื่อวันที่ 19 พ.ย. ที่ผ่านมา:

    1. Future trends: แนวโน้ม AI ในโลกอนาคต
    2. How to AI transformation: แนวคิดในการทำ AI transformation ในองค์กร
    3. Factors to consider: ปัจจัยที่ควรพิจารณาในการทำ AI transformation
    4. People management: การบริหารพนักงานในองค์กรในยุคของ AI
    5. Risks to consider: ความเสี่ยงในการทำ AI transformation
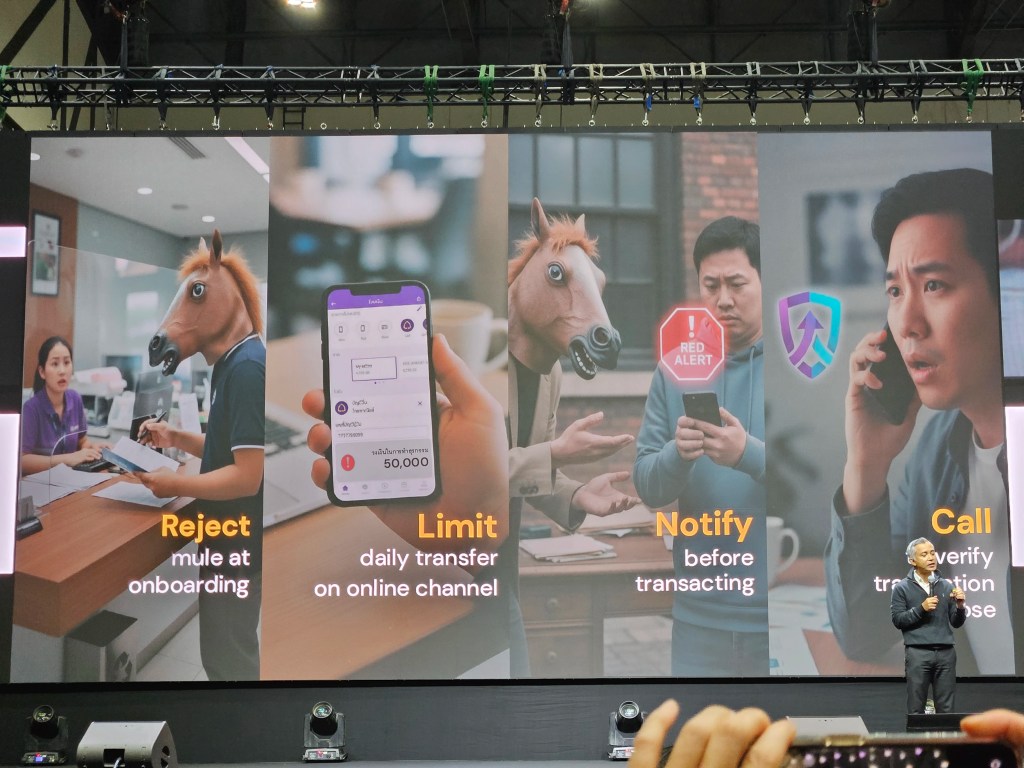
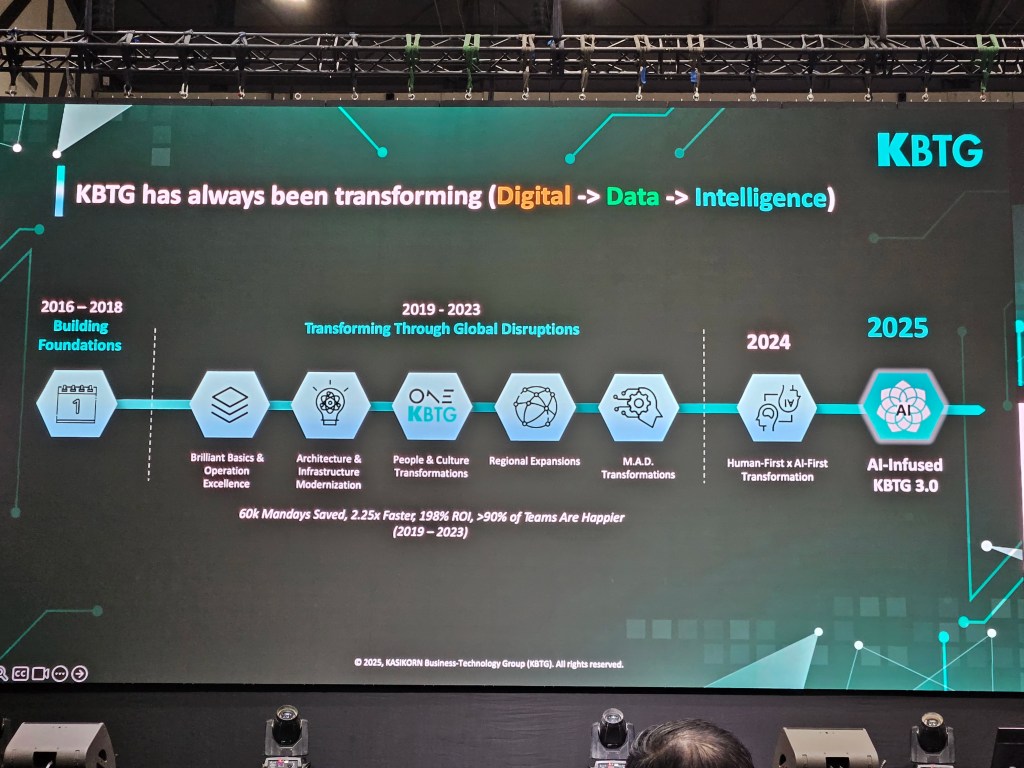
    6. AI solution showcases: ตัวอย่าง AI solutions จาก SCBX และ KBTG
    7. Surviving in the age of AI: แนวคิดในการเอาตัวรอดในยุค AI

    ถ้าพร้อมแล้ว ไปเริ่มกันเลย


    ประเด็นในเรื่อง future trends มีอยู่ 3 เรื่อง ได้แก่:

    1. AI is here to stay
    2. AI, more agentic
    3. Human-AI collaboration

    .

    🤖 AI Is Here to Stay.

    AI ก็เหมือนกับคอมพิวเตอร์ในยุคก่อน เราไม่มีทางที่จะย้อนกลับไปในยุคที่ไม่มี AI อีกแล้ว และเราต้องเรียนรู้ที่จะอยู่ร่วมกับ AI

    .

    😎 AI, More Agentic

    การใช้งาน AI เปลี่ยนจากการใช้ GenAI มาเป็น agentic AI มากขึ้นเรื่อย ๆ (สอดคล้องกับเวทีในปีก่อนที่บอกว่า การใช้ AI ในปี 2025 จะกลายมาเป็น agentic AI)

    .

    🤝 Human-AI Collaboration

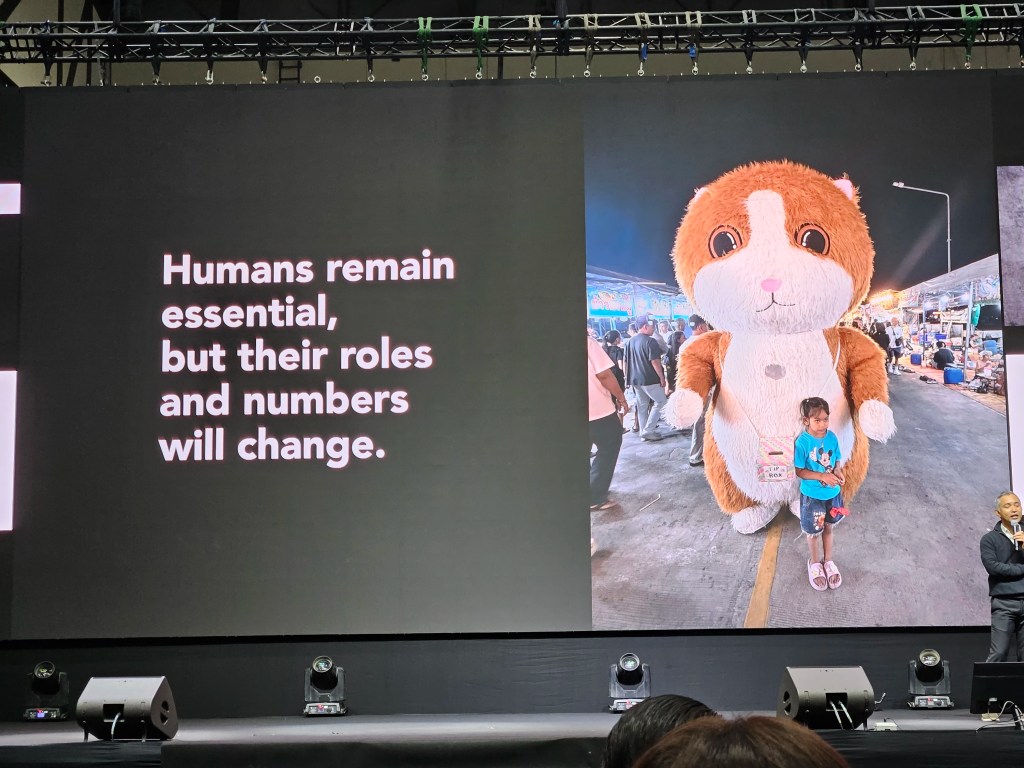
    มนุษย์จะยังคงเป็นส่วนสำคัญในโลก แต่บทบาทของมนุษย์จะเปลี่ยนแปลงไป แต่เปลี่ยนแปลงไปยังไง ยังไม่มีใครรู้แน่ชัด


    👷 Topic 2. How to AI Transformation

    แนวคิดในการทำ AI transformation ในองค์กรมีอยู่ 5 ขั้นตอน ได้แก่:

    1. Pain points
    2. Prioritise, relentlessly
    3. Set goal and plan
    4. Communicate
    5. Track success

    .

    🫨 Pain Points

    เราไม่ควร transform เพียงเพราะองค์กรอื่นทำได้ เพราะแต่ละองค์กรมีบริบทที่แตกต่างกัน การที่ Amazon ทำได้ ไม่ได้หมายความว่า Google หรือเราจะทำได้ด้วยวิธีการเดียวกัน

    AI transformation ไม่มี one-size-fits-all และสิ่งที่เราต้องการหา pain point ให้เจอ: อะไรคือปัญหาที่เราต้องการแก้ในองค์กรของเรา?

    วิธีหนึ่งที่ช่วยให้เรามองเห็นปัญหาได้ คือ การลงไปดูหน้างานจริง

    ยกตัวอย่าง Makro ที่พบว่า พนักงานมีปัญหาในการยกถุงผงซักฟองลงจากชั้นวาง เพราะพนักงานส่วนใหญ่เป็นผู้หญิงและถุงผงซักฟองมีน้ำหนักมาก Makro จะไม่เห็นปัญหานี้เลยถ้าผู้จัดการนั่งอยู่แต่ในออฟฟิศ เพราะบนรายงานการขาย เราจะเห็นแค่ว่าผงซักฟองเป็นสินค้าขายดี

    .

    💪 Prioritise, Relentlessly

    ในองค์กร เราอาจจะมีปัญหามากมายที่เราต้องการแก้ไข:

    • เพิ่ม productivity
    • พัฒนา product ใหม่
    • เพิ่ม engagement กับลูกค้า

    แต่ด้วยเวลาและงบประมาณ เราจะต้องเลือกว่าจะจัดการปัญหาไหนก่อน

    เราจะต้องคอยจัดลำดับความสำคัญอย่างไม่ลดละเพื่อไม่ให้เราหลงทางในยุคที่การเปลี่ยนแปลงและปัญหาเกิดขึ้นอย่างรวดเร็ว

    เรามี 3 frameworks ที่ช่วยเราได้:

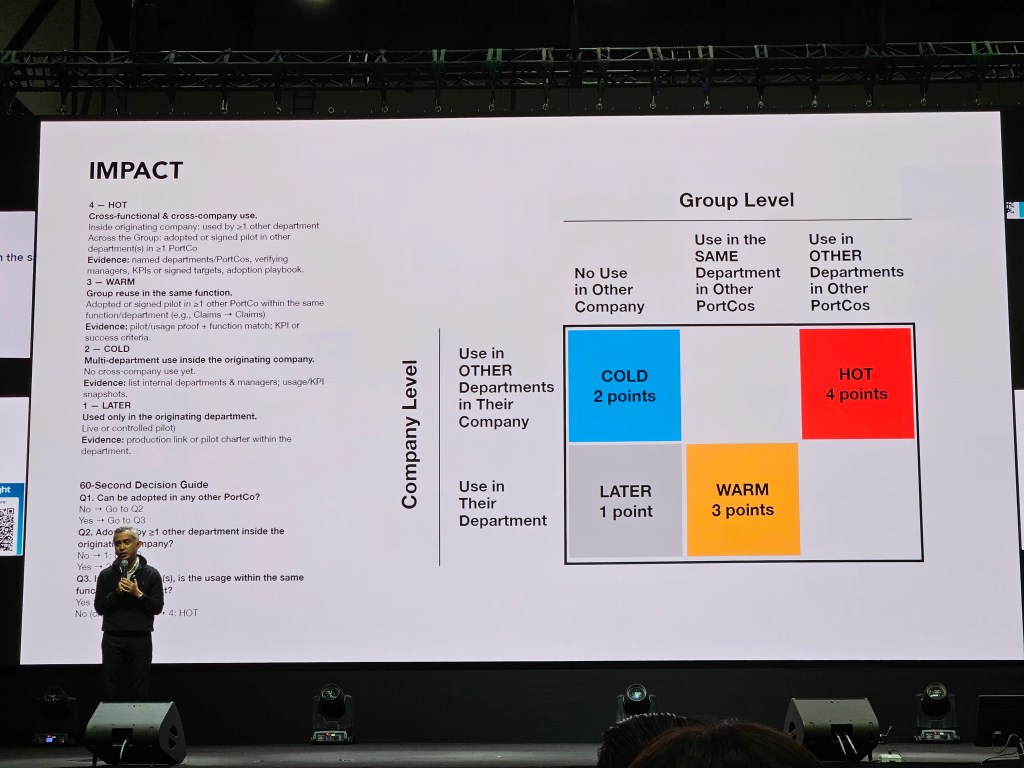
    Framework #1. Impact: ดูว่า AI solution ที่เราจะทำ สามารถใช้ได้ทั้งในระดับกลุ่ม (group level) และบริษัท (company level) ไหม

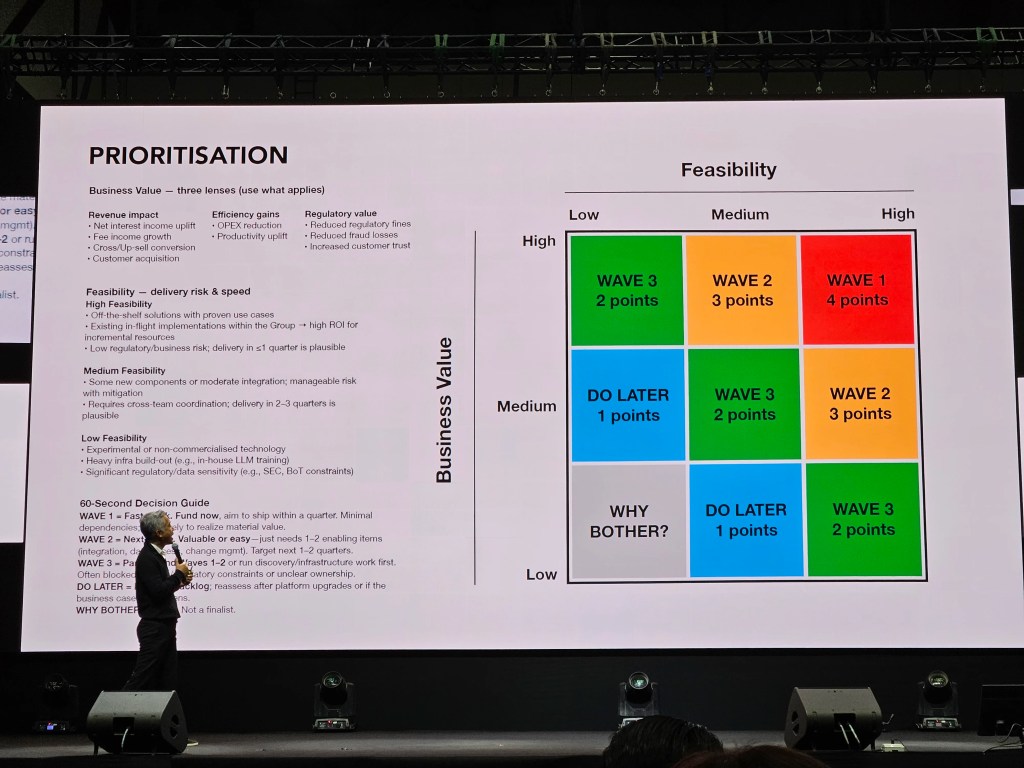
    Framework #2. Priority: ดูความเป็นไปได้ในการประยุกต์ใช้ (feasibility) และคุณค่าทางธุรกิจ (business value) ที่เราจะได้รับ

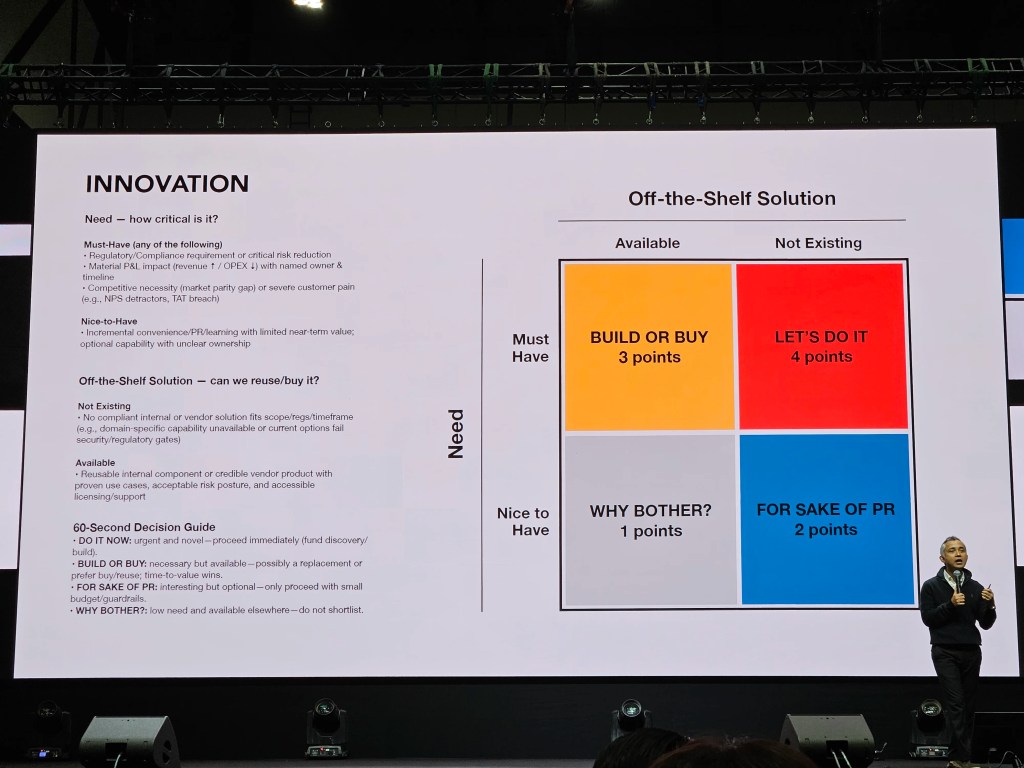
    Framework #3. Innovation: ดูว่า AI solution ที่เราต้องการมีคนทำอยู่แล้วไหม (off-the-shelf solution) และระดับความต้องการของเรา (need)

    .

    ⛰️ Set Goal & Plan

    เมื่อเราได้ปัญหาที่เราต้องการแก้ไขแล้ว สิ่งต่อไปที่เราต้องทำ คือ กำหนดเป้าหมายและวางแผน

    เราอาจจะวางแผน 1 ปี, 3 ปี, 5 ปี ซึ่งยิ่งแผนระยะยาวเท่าไร ก็ยิ่งมีโอกาสจะเปลี่ยนได้ง่าย เพราะเทคโนโลยีมีการเปลี่ยนแปลงอย่างรวดเร็ว อย่างแผน 5 ปีในปีนี้อาจแตกต่างกันอย่างสิ้นเชิงกับแผน 5 ปีในปีหน้า

    แต่มีแผนดีกว่าไม่มีแผน เพราะอย่างน้อย เราจะรู้ว่าเราจะต้องทำอะไร และแม้แผนจะเปลี่ยน แต่เป้าหมายเรายังเหมือนเดิม

    .

    👄 Communicate

    การตั้งเป้าหมายไม่พอ เรายังต้องสื่อสารและทำให้แน่ใจว่า ทุกคนเห็นและเข้าใจเป้าหมายเดียวกัน

    ถ้าเราทำให้ทุกคนเห็นเป้าหมายเดียวกันได้ แม้ต่างคนต่างจะมี job to be done ที่แตกต่างกัน แต่ทุกคนก็จะยังเดินไปในทิศทางเดียวกัน

    .

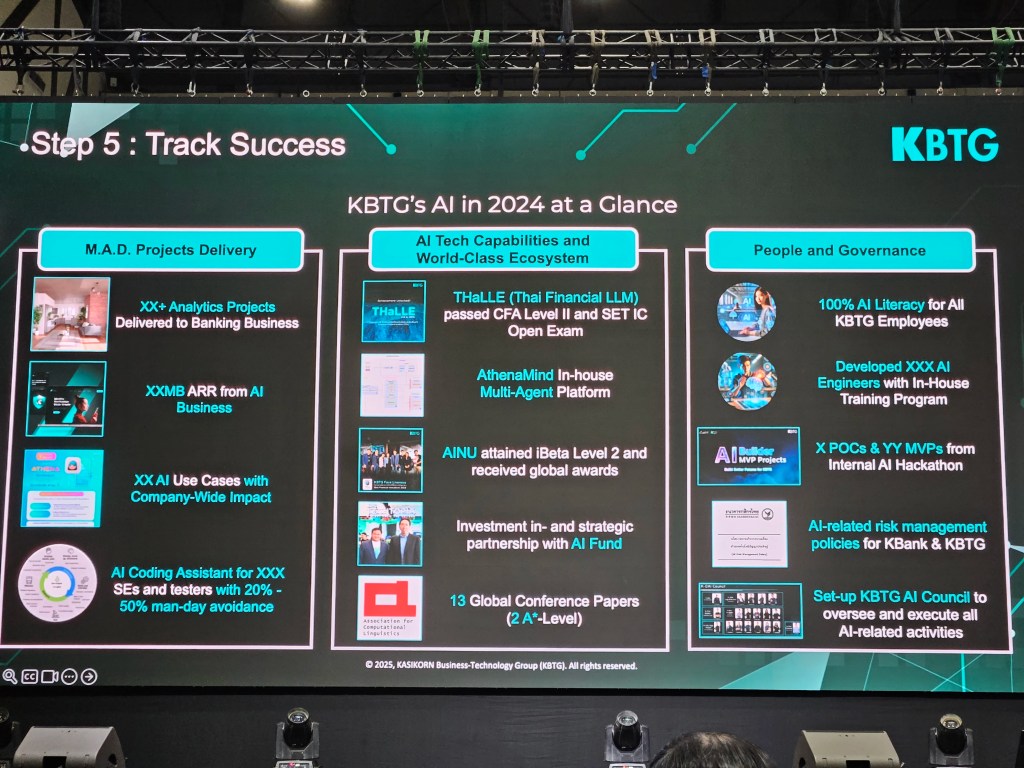
    📋 Track Success

    สุดท้าย เราจะต้องคอยติดตามผลความคืบหน้า เพื่อให้เราปรับเปลี่ยนวิธีการตามหน้างาน และทำให้แน่ใจว่า เรายังมุ่งหน้าไปในทิศที่เราต้องการอยู่


    ☝️ Topic 3. Factors to Consider

    เรามีปัจจัยที่ต้องพิจารณาในการทำ AI transformation มีอยู่ 4 อย่าง ได้แก่:

    1. People: พนักงานและลูกค้าของเรา
    2. Culture: วัฒนธรรมขององค์กร
    3. Systems/tools/tech: ระบบ เครื่องมือ และเทคโนโลยี
    4. Finance: เงิน (เพราะองค์กรอยู่ได้ด้วยเงินทุน)

    People เป็นสิ่งที่เราต้องให้ความสำคัญเป็นอันดับแรก เพราะถ้าเราโฟกัสที่ technology แต่พนักงานหรือลูกค้าไม่พร้อมที่จะใช้เครื่องมือใหม่ เราอาจจะได้ AI solution ที่ไม่มีใครใช้


    🤠 Topic 4. People Management

    การบริหารพนักงานในยุคของ AI มีอยู่ 3 หัวข้อ ได้แก่:

    1. Mindset
    2. Building culture
    3. Generation gap

    .

    ♥️ Mindset

    สิ่งที่เราต้องการในพนักงาน คือ mindset เพราะถ้าขาด mindset ที่เหมาะสม ไม่ว่าเราจะทำ AI transformation ดีขนาดไหน ก็อาจจะไม่สำเร็จ

    Mindset อาจจะเริ่มที่ตัวเราก่อน เช่น ถ้าเราอยากทำ AI transformation แต่เราไม่ชอบ AI เราต้องหันกลับมามองว่า ถ้า AI เป็นสิ่งที่หลีกเลี่ยงไม่ได้ เป็นเราหรือเปล่าที่จะต้องเปลี่ยน

    ถ้าเราไม่เปลี่ยน โลกก็จะเคลื่อนไปข้างหน้าโดยไม่มีเรา

    .

    😈 Building Culture

    สิ่งที่เราต้องการในองค์กร คือ diversity

    เราไม่ต้องการพนักงานที่มีลักษณะนิสัยเหมือนกันหมด เพราะ culture ที่มีคนแบบเดียวกัน คือ culture ที่จะหยุดนิ่ง เปลี่ยนแปลงได้ยาก

    ในการคัดเลือกพนักงาน เราไม่ควรปล่อยให้หัวหน้างานเลือกพนักงานเอง แต่ควรมีกระบวนการที่จะช่วยให้เราคัดเลือกพนักงานอย่างไม่ลำเอียงได้ เช่น มีการสัมภาษณ์หลายครั้งเพื่อให้ได้ความเห็นจากหลายมุมมอง

    นอกจากนี้ เราควรบอกว่า คนที่เป็น “ขบถ” หรือแตกต่าง มากกว่ามองหา “ขนมเปี๊ยะ” หรือคนที่ดูภายนอกหน้าตาเหมือนกันไปหมด

    .

    👶 Generation Gap

    Generation gap เป็นสิ่งที่หลีกเลี่ยงได้ยาก โดยเฉพาะในองค์กรขนาดใหญ่

    แต่ละ generation มีมุมมอง จุดแข็งและจุดอ่อนที่แตกต่างกันไป ซึ่งบางทีก็ทำให้เกิด conflict ระหว่างพนักงานได้

    ถ้าเราอยากทำให้เกิด collaboration แทน เราจะต้องโฟกัสไปที่จุดแข็งของแต่ละ generation เช่น:

    • Generation ที่อายุมากกว่า อาจจะไม่เชี่ยวชาญเทคโนโลยีเท่ากับรุ่นใหม่ แต่มีประสบการณ์และความเชี่ยวชาญมากกว่า
    • Generation ที่อายุน้อยกว่า แม้จะไม่มีประสบการณ์เท่ากับคนรุ่นก่อน แต่ก็มีความเชี่ยวชาญและคุ้นชินกับเทคโนโลยีใหม่ ๆ มากกว่า

    ถ้าเราสามารถดึงจุดแข็งของแต่ละรุ่นขึ้นมา เราก็จะทำให้เกิด collaboration ระหว่างพนักงานในองค์กรได้


    🚨 Topic 5. Risks to Consider

    ความเสี่ยงในการทำ AI transformation มีอยู่ 8 ข้อ ได้แก่:

    1. Cybersecurity threat: ความปลอดภัยของระบบ
    2. Employee resistance: การต่อต้านของพนักงาน
    3. Cost overrun: ใช้งบประมาณเกินกำหนด
    4. Data loss: การสูญเสียข้อมูล โดยเฉพาะข้อมูลที่สำคัญต่อองค์กร
    5. Vendor lock-in: การพึ่งพา vendor แค่เจ้าเดียว
    6. Compliance issues: ปัญหาการปฏิบัติตามกฎ ระเบียบ และข้อบังคับต่าง ๆ
    7. System downtime: ระบบหยุดทำงานและส่งผลต่อการทำงานของพนักงาน
    8. Integration challenges: ความท้าทายในการเชื่อมต่อกับระบบอื่น ๆ

    👾 Topic 6. AI Solution Showcases: SCBX & KBTG

    .

    🟣 SCBX

    SCBX นำเสนอ 2 ตัวอย่างการใช้ AI เพื่อแก้ปัญหาในองค์กร ได้แก่:

    1. ARIS (Advanced Reputation Intelligence System)
    2. PITAG (Predictive Intelligence for Tactical Anti-fraud Guardian)

    Case 1. ARIS เป็นระบบตรวจจับ incident หรือเหตุการณ์ที่อาจสร้างความเสียหายต่อชื่อเสียงขององค์กร ซึ่งช่วยให้ SCBX สามารถรับรู้และรับมือ incident ต่าง ๆ (เช่น ข่าวว่าแอป SCB ถูกแฮ็ก) ได้อย่างทันท่วงที

    ARIS มีการทำงาน 4 ขั้นตอน:

    1. Data pruning: คัดกรอง content บนอินเทอร์เน็ตที่เกี่ยวข้องกับ SCBX (เช่น แอป SCB)
    2. Sentiment analysis: แยกประเภท content เป็นเขียว เหลือง และแดง พร้อมจับกลุ่ม content ที่อยู่ในหัวข้อเดียวกัน (เช่น แอป SCB ขัดข้อง)
    3. Incident detection: ประเมินว่า แต่ละหัวข้อ (แอป SCB ขัดข้อง) เป็น incident ไหม และถ้าใช่ เป็น incident ระดับไหน
    4. Real-time dashboard: แสดงผลบนหน้าจอ เพื่อให้พนักงานรับรู้ถึง incident ได้แบบ real-time

    Case 2. PITAG เป็น agentic AI สำหรับตรวจจับ fraud และแบ่งการทำงานเป็น 4 ขั้นตอน:

    1. Data collector agent: รวบรวมข้อมูลเกี่ยวกับลูกค้า ทั้งข้อมูลบนระบบ และข้อมูลจากแหล่งอื่น ๆ (เช่น หน่วยงานทางการเงินที่เกี่ยวข้อง)
    2. Investigator agent: ตรวจสอบข้อมูลและประเมินแนวโน้มที่จะเป็น fraud
    3. Executor agent: จัดการกับเคสความเสี่ยง (เช่น โทรขอข้อมูลเพิ่มเติมจากลูกค้า หรือจำกัดวงเงินในการใช้งาน)
    4. Governance agent: กำกับการทำงานของ agents ให้เป็นไปตามกฎระเบียบข้อบังคับ

    .

    🟢 KBTG

    KBTG นำเสนอ 6 AI use cases ในองค์กร ได้แก่:

    1. Increase revenue: เพิ่มรายได้ให้กับองค์กร เช่น เพิ่มยอด sales leads, เพิ่มยอด conversion ผ่าน product และ promotion recommendation
    2. Reduce risk: ลดความเสี่ยงในการทำธุรกรรม เช่น การประเมิน credit score
    3. Streamline operation: ลดเวลาในการทำงาน เช่น ใช้ AI ช่วยประเมินความเสียหายของรถยนต์ และปรับแต่งรูปอสังหาริมทรัพย์เพื่อลงประกาศขาย
    4. Protect customers: รักษาความปลอดภัยให้กับลูกค้า เช่น AINU ระบบยืนยันตัวตนด้วย AI
    5. Improve productivity: เพิ่ม productivity เช่น ใช้ AI ช่วยเขียน code ซึ่งลดเวลาจากหลายชั่วโมงเหลือไม่กี่นาที
    6. New products/services: พัฒนา products ใหม่ ๆ เช่น แอปเหมียวจด และ Future You แอปสำหรับพัฒนาตัวเองผ่านการพูดคุยกับตัวเองในอนาคต

    💡 Topic 7. Surviving in the Age of AI

    ผมขอทิ้งท้ายบทความด้วย 10 ข้อคิดดี ๆ ในการเอาตัวรอดในยุค AI:

    1. Focus on one problem at a time. If you focus on many problems, a year from now you’ll still be where you are now.
    2. Break your goal into smaller ones. Get the small wins first.
    3. Don’t be afraid to fail; if you are, you’ve already failed.
    4. ผิดพลาดได้ แต่สิ่งที่สำคัญ คือ จะทำยังไงให้ไม่ผิดซ้ำ
    5. Be resilient, be persistent.
    6. เราไม่ต้องกลัว AI แทนที่เรา ถ้าเรายังพัฒนาตัวเองอยู่เสมอ
    7. คนที่จะมาแทนที่เราไม่ใช่ AI แค่คือคนที่ใช้ AI เก่งกว่าเรา
    8. สร้าง blue ocean ของตัวเอง ด้วยการทำสิ่งที่ไม่เหมือนใคร
    9. ทำงานเร็วจะต้องตั้งอยู่บนความเป็นจริงและตรงเป้าหมาย ไม่อย่างนั้น ก็จะเป็นความเร็วไร้ทิศทางที่ทำให้เราพังเร็วขึ้น
    10. ความเร็วไม่ใช่ทุกอย่าง แต่ละคนเก่งไม่เหมือนกัน เราจะต้องหาให้เจอว่า ใครทำอะไรได้ดีและหางานนั้นให้เขาทำ

    🎤 List of Sessions

    7 หัวข้อบนเวที Global Tech Conference:

    1. ดิจิทัลไม่ใช่แค่ฝ่าย IT แต่คือภารกิจของ CEO ในการขับเคลื่อนองค์กร โดย คุณสุธีรพันธุ์ สักรวัตร, ประธานเจ้าหน้าที่ฝ่ายการตลาด, SCBX
    2. จากวิสัยทัศน์สู่ความเร็ว: คู่มือทรานส์ฟอร์มองค์กรสู่ยุคเรียลไทม์ โดย ดร.ธีรเดช ดำรงค์พลาสิทธิ์, หัวหน้าคณะผู้บริหารด้านกลุ่มธุรกิจองค์กร, True Corporation
    3. Technology & Talent Transformation โดย คุณ Shaun Wong, Chief Corporate Planning Officer, CP Axtra
    4. พลิกมุมคิด ผู้นำ ธุรกิจยุคใหม่: ทรานส์ฟอร์มองค์กรอย่างไรให้รอดในปี 2030 โดย คุณกานติมา เลอเลิศยุติธรรม, รองประธานเจ้าหน้าที่บริหาร ด้านธุรธิจองค์กร, AIS
    5. Smart CEO in AI Era: ผู้นำองค์กรต้องปรับตัวอย่างไรในโลกที่ AI วิ่งเร็วกว่าเรา โดย ดร.ธรรม์ธีร์ สุกโชติรัตน์, CEO, JIB AI
    6. จากดิจิทัลสู่ความอัจฉริยะ: ก้าวต่อไปของเทคโนโลยีธุรกิจยุคใหม่ โดย ดร.ทัดพงศ์ พงศ์ถาวรกมล, กรรมการผู้จัดการ, KBTG
    7. The New Corporate DNA: สร้างองค์กรไว ปรับง่ายโตได้ทุกจังหวะ โดย คุณเปา พีรดนย์ เหมยากร, ประธานเจ้าหน้าที่บริหารและผู้ก่อตั้ง, iHAVECPU

  • วิเคราะห์ resumes ใน 3 ขั้นตอน ด้วย Gemini ผ่าน OpenAI library ใน Python — ตัวอย่างการทำงานใน Google Colab

    วิเคราะห์ resumes ใน 3 ขั้นตอน ด้วย Gemini ผ่าน OpenAI library ใน Python — ตัวอย่างการทำงานใน Google Colab

    บทความนี้เหมาะสำหรับบริษัทหรือ HR ที่ต้องการใช้ AI ช่วยลดเวลาในการคัดกรองผู้สมัคร เพราะเราจะมาดูวิธีวิเคราะห์ resumes ด้วย Gemini ผ่าน OpenAI library ใน Python กัน

    บทความนี้แบ่งเป็น 3 ส่วนตามขั้นตอนการวิเคราะห์ ได้แก่:

    1. Install and load libraries
    2. Set input
    3. Analyse resumes

    โดยเราจะไปดูตัวอย่างโดยใช้ Google Colab กัน (ดู code ทั้งหมดได้ที่นี่)

    ถ้าพร้อมแล้ว ไปเริ่มกันเลย


    ⬇️ 1. Install & Load Libraries

    ในขั้นแรก เราจะเรียกติดตั้งและโหลด libraries ที่จำเป็นดังนี้:

    • openai: สำหรับเรียกใช้ AI ผ่าน API
    • drive จาก google.colab: สำหรับเชื่อมต่อกับไฟล์ใน Google Drive
    • PyPDF2: สำหรับดึง text ออกจากไฟล์ PDF
    • textwrap: สำหรับลบย่อหน้าออกจาก string
    • Console จาก rich.console และ Markdown จาก rich.markdown: สำหรับ render การแสดงผล string ให้อ่านง่ายขึ้น

    ติดตั้ง:

    # Install libraries
    !pip install PyPDF2
    

    Note: Google Colab มี libraries อื่น ๆ อยู่แล้ว ทำให้เราแค่ต้องติดตั้ง PyPDF2 อย่างเดียว

    โหลด:

    # Load libraries
    
    # Connect to Gemini
    from openai import OpenAI
    
    # Connect to Google Drive
    from google.colab import drive
    
    # Extract text from PDF
    import PyPDF2
    
    # Dedent text
    import textwrap
    
    # Render markdown text
    from rich.console import Console
    from rich.markdown import Markdown
    

    🔧 2. Set the Input

    สำหรับการวิเคราะห์ resumes เราต้องการ input 3 อย่าง ได้แก่:

    1. Client: สำหรับเรียกใช้ Gemini API
    2. Job description (JD): รายละเอียดตำแหน่งงานที่กำลังต้องการพนักงาน
    3. Resumes: ข้อมูล resume ที่เราต้องการวิเคราะห์

    เราไปดูวิธีกำหนด input แต่ละตัวกัน

    .

    🧑‍💻 (1) Client

    เราสามารถกำหนด client ได้ด้วย OpenAI() ซึ่งต้องการ 2 arguments:

    1. api_key: API key สำหรับเชื่อมต่อ API
    2. base_url: base URL สำหรับเรียกใช้ AI service ซึ่งสำหรับ Gemini เราต้องกำหนดเป็น "<https://generativelanguage.googleapis.com/v1beta/openai/>"

    ในตัวอย่าง เราจะเรียกใช้ OpenAI() แบบนี้:

    # Create a client
    client = OpenAI(api_key="YOUR_API_KEY", base_url="<https://generativelanguage.googleapis.com/v1beta/openai/>")
    

    Note: ในกรณีใช้งานจริง ให้แทนที่ "YOUR_API_KEY" ด้วย API key จริง (ดูวิธีสร้าง API key ฟรีได้ที่ Using Gemini API keys)

    .

    💼 (2) JD

    Input ที่ 2 สำหรับการวิเคราะห์ คือ JD ซึ่งเราสามารถกำหนดเป็น string ได้แบบนี้:

    # Set the job description (JD)
    web_dev_jd = """
    Senior Web Developer
    
    We're looking for a Senior Web Developer with a strong background in front-end development and a passion for creating dynamic, intuitive web experiences. The ideal candidate will have extensive experience with the entire development lifecycle, from project conception to final deployment and quality assurance. This role requires a blend of technical skill, creative collaboration, and a commitment to solving complex programming challenges.
    
    Responsibilities
    * Cooperate with designers to create clean, responsive interfaces and intuitive user experiences.
    * Develop and maintain project concepts, ensuring an optimal workflow throughout the development cycle.
    * Work with a team to manage large, complex design projects for corporate clients.
    * Complete detailed programming tasks for both front-end and back-end server code.
    * Conduct quality assurance tests to discover errors and optimize usability for all projects.
    
    Qualifications
    * Bachelor's degree in Computer Information Systems or a related field.
    * Proven experience in all stages of the development cycle for dynamic web projects.
    * Expertise in programming languages including PHP OOP, HTML5, JavaScript, CSS, and MySQL.
    * Familiarity with various PHP frameworks such as Zend, Codeigniter, and Symfony.
    * A strong background in project management and customer relations.
    """
    

    Note: ในกรณีที่ JD เป็นไฟล์ PDF เราสามารถใช้วิธีดึงข้อมูลแบบเดียวกันกับ resumes ได้

    .

    📄 (3) Resumes

    Input สุดท้าย คือ resumes ที่เราต้องการวิเคราะห์

    ในตัวอย่าง เราจะดึงข้อมูล resumes จากไฟล์ PDF ใน Google Drive ใน 3 ขั้นตอน ได้แก่:

    ขั้นที่ 1. เชื่อมต่อ Google Drive ด้วย drive.mount():

    # Connect to Google Drive
    drive.mount("/content/drive")
    

    Note: Google จะถามยืนยันการให้สิทธิ์เข้าถึงไฟล์ใน Drive ให้เรากดยืนยันเพื่อไปต่อ

    ขั้นที่ 2. กำหนด file path ของไฟล์ PDF ใน Google Drive:

    # Set resume file paths
    rs_file_paths = {
        "George Evans": "/content/drive/My Drive/Resumes/cv_george_evans.pdf",
        "Robert Richardson": "/content/drive/My Drive/Resumes/cv_robert_richardson.pdf",
        "Christine Smith": "/content/drive/My Drive/Resumes/cv_christine_smith.pdf"
    }
    

    Note: ในตัวอย่าง จะเห็นว่า เรามี resumes 3 ใบ (ดาวน์โหลด resumes ฟรีได้ที่ www.coolfreecv.com)

    ขั้นที่ 3. ดึง text ออกจาก resumes ด้วย for loop และ PyPDF2:

    # Extract resume texts
    
    # Instantiate a collector
    rs_texts = {}
    
    # Loop through resume files to get text
    for key in rs_file_paths:
    
        # Instantiate an empty string to store the extracted text
        rs_text = ""
    
        # Open the PDF file
        reader = PyPDF2.PdfReader(rs_file_paths[key])
    
        # Loop through the pages
        for i in range(len(reader.pages)):
    
            # Extract the text from the page
            text = reader.pages[i].extract_text()
    
            # Append the text to the string
            rs_text += text
    
        # Collect the extracted text
        rs_texts[key] = rs_text
    

    ตัวอย่าง PDF และข้อมูลที่ดึงจาก PDF:

    Source: www.coolfreecv.com
    Contact  
    +1 (970) 343  888 999 
    george.evans@gmail.com  
    <https://www.coolfreecv.com>  
    32 ELM STREET MADISON, SD 
    57042  
     George  Evans  
    PHP / OOP   
    Zend Framework  Summary  
    Senior Web Developer specializing in front end development . 
    Experienced with all stages of the development cycle for dynamic 
    web projects. Well -versed in numerous programming languages 
    including HTML5, PHP OOP, JavaScript, CSS, MySQL. Strong 
    background in project management and customer relations. 
    Perceived as versatile, unconventional and committed, I am 
    looking for new and interesting programming challenges.  
    Experience  
    Web Developer - 09/201 8 to 05/20 22 
    Luna Web Design, New York  
    • Cooperate with designers to create clean interfaces and 
    simple, intuitive interactions and experiences.  
    • Develop project concepts and maintain optimal workflow.  
    • Work with senior developer to manage large, complex 
    design projects for corporate clients.  
    • Complete detailed programming and development tasks 
    for front end public and internal websites as well as 
    challenging back -end server code.  
    • Carry out quality assurance tests to discover errors and 
    optimize usability.  
    Education  
    Bachelor of Science: Computer Information Systems  - 2018  
    Columbia University, NY  
     
    Certifications  
    PHP Framework (certificate): Zend, Codeigniter, Symfony. 
    Programming Languages: JavaScript, HTML5, PHP OOP, CSS, SQL, 
    MySQL.  
    Reference  
    Adam Smith - Luna Web Design  
    adam.smith@luna.com  +1(970 )555 555  Skills   
    JavaScript   Symfony Framework
    

    ⚡ 3. Analyse the Resumes

    ในขั้นสุดท้าย เราจะเปรียบเทียบความเหมาะสมของ resumes กับตำแหน่งงาน (JD) ใน 4 ขั้นตอน ดังนี้:

    1. สร้าง function เพื่อเรียกใช้ Gemini
    2. สร้าง function เพื่อใส่ input ใน prompt
    3. วิเคราะห์ resumes โดยใช้ for loop และ functions จากข้อ 1, 2
    4. Print ผลการวิเคราะห์

    .

    🤖 (1) Function เรียกใช้งาน Gemini

    ในขั้นแรก เราจะสร้าง function สำหรับเรียกใช้ Gemini เพื่อให้ง่ายในการใช้งาน AI

    ในตัวอย่าง เราจะกำหนด 3 arguments สำหรับ function:

    1. prompts: list เก็บ system prompt และ user prompt
    2. model: model ของ Gemini ที่เราจะเรียกใช้ (เช่น Gemini 2.5 Flash)
    3. temp: ระดับความคิดสร้างสรรค์ของ model โดยมีค่าระหว่าง 0 และ 2 โดย 0 จะทำให้ model ให้คำตอบเหมือนกันทุกครั้ง และ 2 คำตอบจะแตกต่างกันทุกครั้ง
    # Create a function to get a Gemini response
    def get_gemini_response(prompts, model, temp):
    
        # Generate a response
        response = client.chat.completions.create(
    
            # Set the prompts
            messages=prompts,
    
            # Set the model
            model=model,
    
            # Set the temperature
            temperature=temp
        )
    
        # Return the response
        return response.choices[0].message.content
    

    .

    ➕ (2) Function ใส่ Input ใน Prompt

    ในขั้นที่ 2 เราจะสร้าง function เพื่อประกอบ input เข้ากับ prompt เพื่อพร้อมที่จะนำไปใช้ใน function ในขั้นที่ 1

    ในตัวอย่างเราจะสร้าง function แบบนี้:

    # Create a function to concatenate prompt + JD + resume
    def concat_input(jd_text, rs_text):
    
        # Set the system prompt
        system_prompt = """
        # 1. Your Role
        You are an expert technical recruiter and resume analyst.
        """
    
        # Set the user prompt
        user_prompt = f"""
        # 2. Your Task
        Your task is to meticulously evaluate a candidate's resume against a specific job description (JD) and provide a detailed pre-screening report.
    
        Your analysis must be structured with the following sections and include specific, data-driven insights.
    
        ## 1. Strengths
        - Identify and elaborate on top three key strengths.
        - For each strength, briefly provide specific evidence from the resume (e.g., "The candidate's experience with Python and Django, as shown in their role at Acme Corp, directly addresses the JD's requirement for...") and explain how it directly fulfills a requirement in the JD.
    
        ## 2. Weaknesses
        - Identify top three areas where the candidate's experience or skills may not fully align with the JD's requirements.
        - For each point, briefly explain the potential concern and why it might be a risk for the role (e.g., "The JD requires experience with AWS, but the resume only mentions exposure to Azure. This could indicate a gap in cloud infrastructure expertise.").
    
        ## 3. Candidate Summary
        - Draft a concise summary of the candidate's professional background.
        - Emphasise their JD-relevant core responsibilities, key achievements, and career progression as evidenced in the resume.
    
        ## 4. Overall Fit Score
        - Provide a numerical score from 1 to 100, representing the overall alignment of the candidate's profile with the JD.
        - A higher score indicates a stronger match: 80-100 = best match; 60-80 = strong match; 0-40 = weak match.
    
        ## 5. Hiring Recommendation
        - Conclude with a clear, binary hiring recommendation: "🟢 Proceed to interview", "🟡 Add to waitlist", or "🔴 Do not proceed".
        - Justify this recommendation with a brief, objective explanation based on the analysis above.
    
        ---
    
        # 3. Your Output
        - Use a professional and objective tone.
        - Base your analysis solely on the provided resume and JD. Do not make assumptions.
        - Be concise and to the point; no more than 30 words per sentence; the hiring manager needs to quickly grasp the key findings.
        - Format your final report using markdown headings and bullet points for readability.
    
        Output template:
        '''
        # [candidate's name (Title Case)] ([fit score]/100)
    
        [recommendation]: [justification]
    
        ## Profile Summary:
        [summary]
    
        ## Strengths:
        - [strength 1]
        - [strength 2]
        - [strength 3]
    
        ## Weaknesses:
        - [weakness 1]
        - [weakness 2]
        - [weakness 3]
        '''
    
        ---
    
        # 4. Your Input
        **1. JD:**
        {jd_text}
    
        **2. Resume:**
        {rs_text}
    
        ---
    
        Generate the report.
        """
    
        # Collect prompts
        prompts = [
            {
                "role": "system",
                "content": textwrap.dedent(system_prompt)
            },
            {
                "role": "user",
                "content": textwrap.dedent(user_prompt)
            }
        ]
    
        # Return the prompts
        return prompts
    

    Note: เราใช้ textwrap.dedent() เพื่อลบย่อหน้าที่เกิดจาก indent ใน function ออกจาก prompt เพื่อป้องกันความผิดพลาดในการประมวลผลของ AI และประหยัด input token

    .

    🤔 (3) วิเคราะห์ Resumes

    ในขั้นที่ 3 ซึ่งเป็นขั้นที่สำคัญที่สุด เราจะวิเคราะห์ resumes โดย:

    • ใช้ functions จากขั้นที่ 1 และ 2 เพื่อสร้าง prompt และส่ง prompt ให้กับ Gemini
    • ใช้ for loop เพื่อส่ง resumes ให้กับ Gemini จนครบทุกใบ
    # Instantiate a response collector
    results = {}
    
    # Loop through the resumes
    for rs_name, rs_text in rs_texts.items():
    
        # Create the prompts
        prompts = concat_input(web_dev_jd, rs_text)
    
        # Get the Gemini response
        response = get_gemini_response(prompts=prompts, model="gemini-2.5-flash", temp=0.5)
    
        # Collect the response
        results[rs_name] = response
    

    เมื่อรัน code นี้แล้ว เราจะได้ผลลัพธ์เก็บไว้ใน results

    .

    👀 (4) Print ผลลัพธ์

    สุดท้าย เราจะ print ผลการวิเคราะห์ออกมา โดย:

    • ใช้ for loop ช่วย print ผลจนครบ
    • ใช้ Console กับ Markdown เพื่อทำให้ข้อความอ่านง่ายขึ้น:
    # Instantiate a console
    console = Console()
    
    # Instantiate a counter
    i = 1
    
    # Print the results
    for rs_name, analysis_result in results.items():
    
        # Print the resume name
        print(f"👇 {i}. {rs_name}:")
    
        # Print the response
        console.print(Markdown(analysis_result))
    
        # Add spacers and divider
        print("\\n")
        print("-----------------------------------------------------------")
        print("\\n")
    
        # Add a counter
        i += 1
    

    ตัวอย่างผลลัพธ์:

    ในตัวอย่าง จะเห็นได้ว่า George Evans เหมาะที่จะเป็น Senior Web Developer


    😺 Code & Input Examples

    • ดูตัวอย่าง code ได้ที่ Google Colab
    • ดูตัวอย่าง JD และ resumes ได้ที่ JD & Resumes

    📃 References