ผมเขียนบทความนี้ เพื่อเป็น reflection session กับตัวเองเกี่ยวกับการเขียนบทความใน 1 ปีที่ผ่านมา (2025)
เพื่อช่วยให้ผมได้ตกผลึกกับตัวเอง บทความนี้เลยเขียนเป็นเหมือนบทสัมภาษณ์ที่มีการถามตอบทั้งหมด 7 ส่วน
ลองไปดูกันว่า ผมเรียนรู้อะไรจากการเขียนบทความมา 1 ปีบ้าง
- 🏁 Q&A 1: ทำไมถึงเริ่มเขียนบทความ?
- 😅 Q&A 2: ก่อนหน้านี้ เคยเขียน blog มาก่อน แต่ทำไมถึงเลิกไป?
- 🤔 Q&A 3: แล้วครั้งนี้ทำไมถึงเขียนได้นานกว่าครั้งก่อน?
- 💪 Q&A 4: ปกติมีวิธีเขียนยังไงบ้าง?
- ✏️ Q&A 5: จากที่เขียนบทความมา 1 ปี ได้เรียนรู้อะไรบ้าง?
- 🔥 Q&A 6: มีอะไรที่คิดว่าปรับปรุงได้ในการเขียนในอนาคต?
- 😌 Q&A 7. มีอะไรอย่างทิ้งท้ายบ้าง?
🏁 Q&A 1: ทำไมถึงเริ่มเขียนบทความ?
ผมเริ่มเขียน post บน WordPress อย่างจริงจังตั้งแต่ต้นปี 2025 ที่ผ่านมา หลังจากได้ร่วมคอร์ส Web for Impact ของพี่ทอย DataRockie ตอนปลายปี 2024
ในคอร์ส พี่ทอยแสดงให้เห็นว่า การมีเว็บไซต์เป็นของตัวเองจะช่วยเปิดโอกาสให้กับเรา ไม่ว่าจะเป็นโอกาสในการหางานหรือโอกาสทางธุรกิจ เพราะเว็บไซต์จะช่วยให้คนรู้จักเรามากขึ้น
แต่การมีเว็บไซต์อย่างเดียวไม่พอ เว็บไซต์จะต้องมี content ที่ดี ที่เป็นประโยชน์กับคนอ่านด้วย เพราะ content ที่ดีจะทำให้เว็บไซต์ของเรามีโอกาสติด search engine และมีคนเข้าถึงเว็บไซต์และรู้จักเรามากขึ้น
😅 Q&A 2: ก่อนหน้านี้ เคยเขียน blog มาก่อน แต่ทำไมถึงเลิกไป?
ผมคิดว่า มีอยู่ 2 ปัจจัย:
.
ข้อ 1. เนื้อหาที่เขียน:
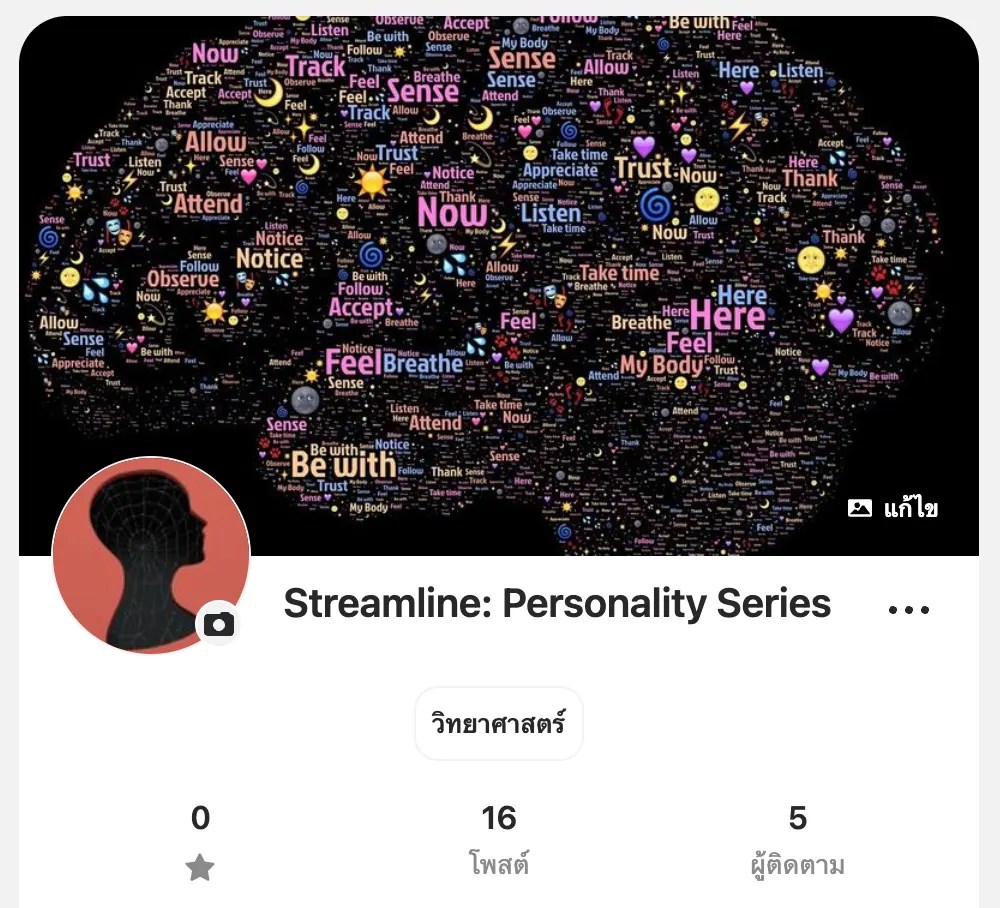
Blog แรกที่ผมเขียนบน Blogdit เป็นบทความเกี่ยวกับจิตวิทยา ซึ่งผมพยายามเขียนเป็นแนววิชาการ (เพราะเป็นแนวเขียนที่ผมถนัด) ซึ่งเป็นการเขียนที่ใช้เวลานาน เพราะต้องหา references ต่าง ๆ
และผมเป็นคนที่อ่าน journal เพราะความสนใจส่วนตัว พอไม่ใช่เรื่องที่สนใจ ผมจะไม่ได้อ่าน และทำให้ไม่มีเนื้อหามาเขียนเป็นบทความ
.
ข้อ 2. ผลตอบรับ:
ซึ่งเป็นประเด็นที่สำคัญกว่า เพราะเราเขียนเพื่อให้เกิด impact แต่พอบทความที่เขียนใช้เวลาเขียน 2–3 วัน หรือ 1 สัปดาห์ไม่ได้มีคนอ่านหรือเข้าถึง ผมก็รู้สึกว่า การเขียนไม่ใช่การลงทุนที่คุ้มค่าเท่าไร
🤔 Q&A 3: แล้วครั้งนี้ทำไมถึงเขียนได้นานกว่าครั้งก่อน?
เพราะ 2 อย่างเหมือนเดิม
.
ข้อ 1. เนื้อหาที่เขียน:
ผมเปลี่ยนจากการเขียนเกี่ยวกับจิตวิทยา มาเขียนเกี่ยวกับการเขียน code แทน
ผมเลือก topic นี้ เพราะช่วงนั้น ผมเพิ่งเรียน Data Science Bootcamp ของพี่ทอยจบใหม่ ๆ และอยากฝึกทักษะการเขียนภาษา R, Python มากขึ้น ผมเลยเลือกสรุปเนื้อหา R, Python ที่ผมกลับมาทบทวนเป็นบทความรายสัปดาห์

ถ้าเป็นเมื่อก่อน ผมคงไม่กล้าเขียนเรื่องอื่นนอกจากจิตวิทยา เพราะไม่ใช่ domain expertise ของผม แต่ผมจำข้อคิดจาก Web for Impact ได้ว่า เราจะเขียนอะไรก็ได้ และถ้าไม่รู้จะเขียนอะไร ก็เขียนในสิ่งที่เราสนใจก่อน ซึ่งในตอนนั้นก็เลยเป็น coding
.
ข้อ 2. ผลตอบรับ:
ข้อนี้เป็นข้อสำคัญ
หลังจากจบ Data Science Bootcamp รุ่น 10 แล้ว ผมได้ทุนเรียนรุ่น 11 ต่อ ทำให้ผมได้เข้าไปอยู่ใน bootcamp community ที่อยู่บน Discord ซึ่งเป็นช่องทางหนึ่งที่ผมแชร์บทความที่ผมเขียนลงไป
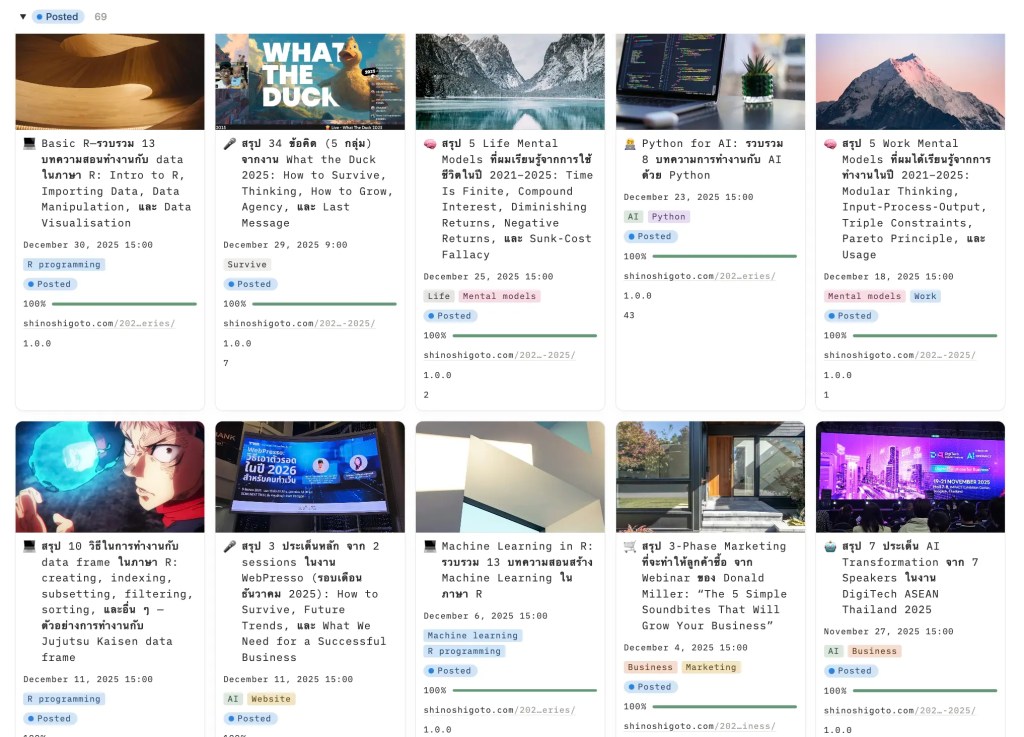
เพราะเนื้อหาในบทความเกี่ยวข้องกับ bootcamp โดยตรง ทำให้มีคนเข้ามาอ่านบทความค่อนข้างมาก ปกติบทความ 1 จะมีคนเข้ามาอ่านอย่างมากก็ 10 คนในวันแรก (post แรก ๆ ของผมไม่มีคนอ่านเลย 😂) แต่มีอยู่บทความหนึ่งที่ผมเขียนสรุปสูตร Google Sheets แล้วมีคนเข้ามาอ่านวันแรกเกือบ 80 คน พอเห็นตัวเลขแล้วยังตกใจไม่หาย เพราะไม่เคยมีคนเข้ามาอ่านเยอะขนาดนี้มาก่อน และบทความนั้นเพิ่งเป็นบทความที่ 3 ที่ผม post ในปีนั้น (ก่อนหน้านั้น ผมเอา post บทความเก่า ๆ จาก Blogdit มาใส่ไว้ใน WordPress)

ตั้งแต่นั้น ผมเลยเรียนรู้ว่า ถ้าเราเขียน content ที่ตอบโจทย์ ก็จะมีคนอ่านงานของเราจริง ๆ และการเขียนไม่ได้เสียเวลาเปล่า และแม้ว่า post หลัง ๆ อาจจะไม่ได้ผลตอบรับดีเหมือนกับบทความ Google Sheets แต่ผมก็ยังมีกำลังเขียนอยู่เรื่อย ๆ
พอเขียนไปได้สักพัก ก็เริ่มมีคนเข้าถึงบทความและรู้จักเรามากขึ้น
เช่น มีเพื่อนใน bootcamp ที่ติดตามผลงาน และช่วยให้กำลังใจ (และเช็กคำผิดให้ 😂🙏)
น้องที่เคยเรียน bootcamp รุ่น 10 ด้วยกันแล้วมาฝึกงานที่บริษัทก็จำผมได้จากบทความที่ลงทุกสัปดาห์
มีน้องฝึกงาน AI ในบริษัทที่เข้ามาแล้ว search เจอบทความการใช้ AI ของผม
และพี่ทอยที่จำผมได้จากการลงบทความลงใน Discord ทุกสัปดาห์

(เลยได้เปิด domain ทุกครั้งที่ถ่ายรูปกับพี่ทอย 🤞😂)

💪 Q&A 4: ปกติมีวิธีเขียนยังไงบ้าง?
ในช่วงแรก ผมไม่ได้มีหลักการอะไรมาก นอกจากเขียนทุกอย่างที่อยากเขียน
ผมพอรู้หลักการเขียนบ้าง จาก Web for Impact และที่เขียนได้ยินคนอื่นพูดถึงการเขียน content ในเว็บ
เช่น เราควรจะกำหนด target audience ก่อนว่า เราจะเขียนให้ใครอ่าน
ผมพยายามใช้ technique นี้แล้ว แต่ปัญหาที่เจอคือ ผมไม่รู้ว่ากำลังเขียนให้ใครอ่าน เพราะผมก็เพิ่งเริ่มเขียน และไม่ได้เป้าหมายชัดเจนว่าอยากจะเข้าถึงคนกลุ่มไหน
Solution ที่ผมชอบมาจากข้อคิดใน Web for Impact คือ ให้เขียนให้ตัวเองอ่าน ซึ่งพอเป็น mindset แบบนี้ ทำให้ผมเขียนได้ง่ายขึ้น เพราะผมรู้ว่า ผมอยากจะเห็นงานเขียนแบบไหน และแบบไหนที่ผมเรียกว่าอ่านง่ายอ่านได้เข้าใจ
.
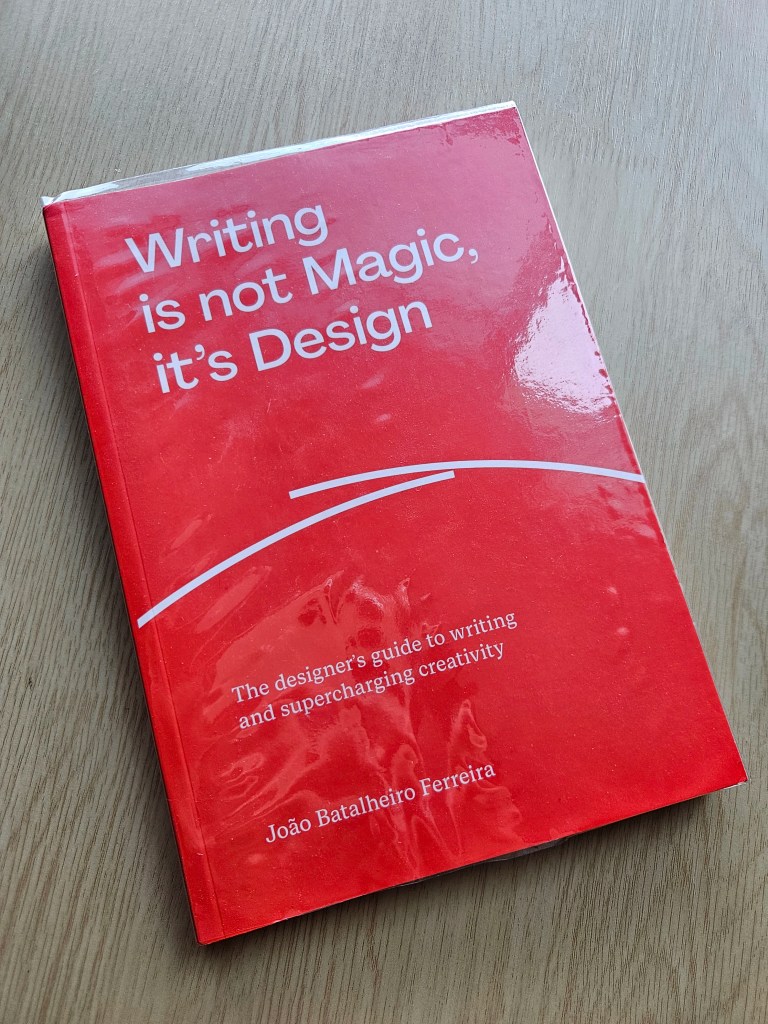
ผมไม่ได้เขียนโดยไม่มี structure เลย แต่ผมไม่ได้ให้ความสำคัญมากจนกระทั่งอ่านหนังสือ Writing Is Not Magic, It’s Design ของ João Batalheiro Ferreira ที่แนะนำว่า การเขียนก็เหมือน creative work อื่น ๆ อย่างการออกแบบ furniture ที่มีกระบวนการ 4 ขั้นตอน (NODE):
- Note: เก็บรวบรวมข้อมูล
- Organise: จัดเรียงข้อมูล เพื่อเป็นโครงในการเขียน
- Draft: ร่าง
- Edit: แก้ไข
เราจะเริ่มเขียนไม่ได้ถ้าเราไม่มีข้อมูลและเอาข้อมูลมาทำเป็นโครงก่อน ตั้งแต่ได้อ่านหนังสือ ผมจะพยายามขึ้นโครงสิ่งที่จะเขียนก่อน แล้วเริ่มเขียนจากโครงนั้นอีกที ซึ่งได้เห็นเองเลยว่าทำให้เขียนง่ายกว่านั่งเขียนโดยไม่มีอะไรเลย
ทั้งนี้ ผมไม่ได้ยึดโครงที่เขียนตั้งแต่แรกตลอด พอเขียนไปได้สักพัก (อย่างบทความที่ทุกคนกำลังอ่านอยู่) ผมก็ปรับเปลี่ยนโครงไปเรื่อย ๆ เพราะบางทีการเขียนจะทำให้เราได้เห็นมุมมองและความคิดใหม่ ๆ ที่เราอยากจะใส่ลงไปในบทความ ซึ่งทำให้เราต้องปรับเปลี่ยนโครง (note → organise → draft) อีกครั้ง
.
อีกบทเรียนที่ได้จากหนังสือ Writing Is Not Magic, It’s Design คือ modular writing หรือการเขียนแบบแบ่งท่อน แทนที่เราจะเขียนทั้งบทความในครั้งเดียว ตั้งแต่ต้นจนจบ เราสามารถแบ่งเขียนได้ เช่น บทความมี 5 ส่วน เราเริ่มเขียนส่วน 3 ที่ง่ายสุดก่อน แล้วค่อยเขียน 2, 4 ที่อยู่ประกอบหัวท้าย แล้วจัดการ 1, 5 หลังสุด เพราะเรามีเนื้อหาตรงกลางครบแล้ว
Modular writing ทำให้การเขียนง่ายขึ้น เพราะเราสามารถเลือกเขียนจากส่วนที่ง่ายที่สุดก่อนได้ เป็นการลด friction ที่เราจะเริ่มเขียนงานในตอนแรก และทำให้เราสามารถเขียนงานออกมาได้เรื่อย ๆ
นอกจากนี้ modular writing ยังทำให้เราถอดประกอบบทความได้ด้วย เช่น บทความ mental models ที่ผมเขียนส่งท้ายปี 2025 ตอนแรกผมคิดว่าจะเขียนเป็นบทความเดียว แต่พอลองเขียนแล้ว เห็นว่า น่าจะแยกเรื่องกันได้ เลยแยกเป็น 2 บทความแทนที่จะเป็น 1 บทความใหญ่
การเขียนแบบ modular writing ช่วยให้เรามีอิสระในการจัดการไอเดีย และจับเอาไอเดียมาลงบนหน้ากระดาษมากขึ้น
.
ผมได้ใช้ NODE และ modular writing จริง ๆ จัง ๆ ตอนเขียนหนังสือ R Book for Psychologists ที่เป็นหนังสือสอนใช้ภาษา R เพื่อวิเคราะห์ข้อมูลสำหรับนักจิตวิทยา (เป็นผลงานผสม domain: จิตวิทยา + coding) เพราะหนังสือมีเนื้อหาหลายส่วน ถ้าผมไม่ได้ NODE ก่อน ผมจะเขียนไม่ได้ตั้งแต่แรก และถ้าไม่ใช้ modular writing ผมก็อาจจะเขียนไม่จบ เพราะไปเขียนติดอยู่ที่บทใดบทหนึ่งของหนังสือ พอใช้ modular writing บทเขียนจากบทที่ง่ายก่อน และในแต่ละบทก็เขียนในส่วนที่เขียนได้ก่อน พอเขียนเสร็จก็ค่อยไปต่อที่ส่วนที่ยากขึ้นมาเรื่อย ๆ

✏️ Q&A 5: จากที่เขียนบทความมา 1 ปี ได้เรียนรู้อะไรบ้าง?
ข้อ 1. “Just do it” is real:
เราเริ่มได้แค่ลงมือทำ เราไม่จำเป็นต้องพร้อมก่อนก็ลงมือทำได้ อย่างตอนแรกที่ผมเขียนบทความ coding แรกสุด ผมก็ไม่ได้คิดว่าตัวเองพร้อมที่จะเขียน 100% แต่ก็เขียนไป เพราะตั้งใจว่าจะเขียนออกมาให้ได้
แล้วพอได้บทความแรก บทความอื่นก็ตามมาเอง
.
ข้อ 2. Writing helps with understanding:
การเขียนช่วยให้เราได้ใช้เวลาคิดในสิ่งที่เขียนมากขึ้น ทำให้เราเข้าใจ concept ต่าง ๆ มากขึ้น
ผมจะเห็นผลชัดกับการเขียน code ภาษา R จากตอนแรกที่เรียน bootcamp จบ ผมยังรู้สึกว่า เขียน R ไม่ได้คล่องมาก แต่พอเขียนบทความเกี่ยวกับ R ไปสักพักก็มีความรู้มากขึ้น เข้าใจมากขึ้น และมั่นใจมากขึ้น เพราะในการเขียนแต่ละบทความ ผมไม่ได้แค่เขียน code ขึ้นมาเฉย ๆ แต่ต้อง run code จริงด้วย เพื่อให้แน่ใจว่า code ที่เขียนไปไม่ผิด และพอ run แล้วเจอ error ผมก็เช็กว่า ผิดพลาดเพราะอะไร และจะแก้ยังไง ทำให้ได้เรียนรู้มากกว่าที่เรียนใน bootcamp
.
ข้อ 3. NODE และ modular writing:
ถ้าอยากเขียนงานให้ดี ควรทำตาม 4 steps: note → organise → draft → edit
และเขียนโดยแบ่งเขียนเป็น module
🔥 Q&A 6: มีอะไรที่คิดว่าปรับปรุงได้ในการเขียนในอนาคต?
ผมคิดว่า มีอยู่ 3 ข้อ:
.
ข้อ 1. Write consistently:
แม้ว่าผมจะ post บทความได้ทุกสัปดาห์ แต่ผมไม่ได้เขียนงานทุกสัปดาห์
ช่วงแรก ๆ ผมเขียนงานสัปดาห์ต่อสัปดาห์ และพยายามสะสมบทความ เผื่อช่วงที่ผมไม่มีเวลาว่างเขียนจริง ๆ จะได้มีบทความลงไม่ขาดตอน
แต่พอสะสมมาได้สักพัก กลายเป็นว่าตอนนี้ ผมมีบทความที่ยังไม่ได้ลงเยอะกว่าที่คิดไว้ ซึ่งเป็นข้อดี เพราะทำให้ผมมีเวลาว่างไปทำอย่างอื่น
แต่ข้อเสียก็คือ ผมไม่ได้เขียนอย่างสม่ำเสมอ ผมจะเขียนก็ต่อเมื่อมีเวลาหรืออยากจะเขียนจริง ๆ
ผมมองว่า ถ้าปรับได้ อาจจะปรับให้ตัวเองกลับมาเขียนอย่างสม่ำเสมอเหมือนกับช่วงแรก ๆ เพื่อที่จะได้เขียนเป็นกิจวัตร แทนที่จะเขียนตามอารมณ์ เพราะกิจวัตรเชื่อถือได้มากกว่าอารมณ์อยากเขียน
.
ข้อ 2. QA before publishing:
สิ่งที่ผมเจอบ่อยก็คือ การสะกดคำผิดหรือใช้คำผิด
แม้ว่า ผมจะอ่านทวนบทความของตัวเองก่อน post แล้ว แต่ผมเพิ่งเจอว่า การอ่านของมนุษย์ไม่ได้ process ทุกตัวอักษร ทำให้เราสามารถมองข้ามการสะกดผิดหรือการใช้คำผิดได้ในบทความตัวเองได้
สิ่งที่ผมทำได้ คือ ใช้ AI ให้เป็นประโยชน์
ในช่วงหลัง ๆ ผมเริ่มโยนบทความที่เขียนเสร็จแล้วให้กับ AI และถามหา 3 อย่าง:
- การสะกดผิด หรือการใช้คำผิด
- ความไม่สอดคล้องในการใช้คำและเนื้อหา (เช่น ใช้คำไทยที อังกฤษที)
- ตรวจสอบความถูกต้องของเนื้อหา (สิ่งที่เขียนไปเป็น inaccurate หรือเปล่า)
ซึ่งพบว่า AI ช่วยผมตรวจพบข้อผิดพลาดเหล่านี้ได้เร็วกว่าและครบถ้วนมากกว่าถ้าเราอ่านเองมาก
แต่ก็ยังพบ limitation ของ AI อยู่ว่า AI จะไม่ได้ตรวจเจอทุกข้อผิดพลาด เช่น พิมพ์คำผิด จาก “รู้จักหนังสือ” เป็น “รู้สึกหนังสือ”
แสดงว่า นอกจากการใช้ AI แล้วผมยังควรจะต้องตรวจสอบเนื้อหาด้วยตัวเองอีกครั้งก่อนจะ publish งานออกไป
.
ข้อ 3. Deliver to a wider audience:
จุดอ่อนหนึ่งของผมคือการทำ marketing เพราะถ้าไม่นับการอ่านหนังสืออย่าง How to Grow Your Small Business ในปีนี้ ผมก็ไม่เคยเรียนหรือทำ marketing อย่างจริงจังมาก่อน
ตอนนี้ การเข้าถึงบทความของผมส่วนใหญ่มาจากการ post ลงใน Discord ของ bootcamp ซึ่งถ้า bootcamp จบแล้ว ผมก็จะขาดการเข้าถึงกลุ่มคนอ่านส่วนใหญ่ไป
ผมจะต้องหาช่องทางอื่นที่จะส่งบทความไปให้ถึงกลุ่มคนอ่านอื่น ๆ ให้ได้มากขึ้น ซึ่งตอนนี้ ผมเริ่มแล้วจากการเปิด Facebook page, Instagram, และ Threads
😌 Q&A 7. มีอะไรอยากทิ้งท้ายบ้าง?
สำหรับคนที่อยากเริ่มเขียน ผมแนะนำว่า:
- Start right away: เริ่มเขียนเลย ไม่ต้องห่วงว่า เขียนไม่เก่ง เพราะฝึกเขียนไปก็จะเขียนดีขึ้นเรื่อย ๆ เอง
- Write for yourself: เริ่มจากเขียนให้ตัวเองอ่านก่อน
- Modular writing: เริ่มเขียนทีละส่วน ไม่ต้องเขียนทั้งหมดทีเดียว
- NODE: อย่าลืมหาข้อมูลและร่างโครงก่อนเขียน จะทำให้เขียนได้ง่ายขึ้นมาก
- Share: เขียนแล้วแชร์ให้คนอื่นฟัง เพื่อรับ feedback มาใช้เขียนงานต่อไปให้ดีขึ้น