ในบทความนี้ เราจะไปดูวิธีใช้ dbplyr ซึ่งเป็น package สำหรับทำงานกับ database ในภาษา R และเหมาะกับคนที่ต้องการทำงานโดยใช้ภาษา R เป็นหลักกัน
ถ้าพร้อมแล้ว ไปเริ่มกันเลย
- 🤔 What Is dbplyr?
- 🏁 Getting Started
- 🏃♂️➡️ Using dbplyr
- 💪 Summary
- 😺 GitHub
- 📃 References
- ✅ R Book for Psychologists: หนังสือภาษา R สำหรับนักจิตวิทยา
🤔 What Is dbplyr?
dbplyr เป็น package ในภาษา R สำหรับทำงานกับ database โดยใช้ dplyr syntax แทน SQL เช่น แทนที่เราเขียน:
SELECT * FROM table
เราสามารถใช้ dplyr syntax ได้แบบนี้:
select(table, everything())
(Note: อ่านวิธีใช้ dplyr ได้ที่นี่)
🏁 Getting Started
เราสามารถเริ่มใช้งาน dbplyr ได้โดยติดตั้งและโหลด 4 packages ดังนี้:
DBI: สำหรับเชื่อมต่อกับ database (อ่านวิธีใช้เพิ่มเติมได้ที่นี่)RSQLite: สำหรับเชื่อมต่อกับ SQLite database (เราจะเปลี่ยน package นี้ตาม database ที่เราใช้ เช่นRPostgresสำหรับ Postgres database)dplyr: สำหรับdplyrsyntax เช่นselect(),filter(),arrange()dbplyr: สำหรับทำงานกับ database ด้วยdplyrsyntax
# Install packages
install.packages("DBI")
install.packages("RSQLite")
install.packages("dplyr")
install.packages("dbplyr")

# Load packages
library(DBI)
library(RSQLite)
library(dplyr)
library(dbplyr)
🏃♂️➡️ Using dbplyr
เราสามารถใช้ dbplyr เพื่อทำงานกับ database ได้ใน 6 ขั้นตอน:
- Connect to the database
- Create a lazy tibble
- Create a query
- Show the query
- Get the result
.
1️⃣ Connect to the Database
ในขั้นแรก เราจะเชื่อมต่อกับ local database ด้วย DBI::dbConnect และ RSQLite::SQLite():
# Connect to database
con <- dbConnect(RSQLite::SQLite(),
                 "chinook.sqlite")
Note: โหลด “chinook.sqlite” ได้จาก GitHub
.
2️⃣ Create a Lazy Tibble
ในขั้นที่ 2 เราจะสร้าง lazy tibble หรือ object ที่ใช้แทน database table ซึ่งทำได้ใน 2 steps:
Step 1. ดูรายชื่อ table ทั้งหมด ใน database ด้วย DBI::dbListTables():
# View all tables
dbListTables(con)
ผลลัพธ์:
 [1] "Album"         "Artist"        "Customer"      "Employee"
 [5] "Genre"         "Invoice"       "InvoiceLine"   "MediaType"
 [9] "Playlist"      "PlaylistTrack" "Track"
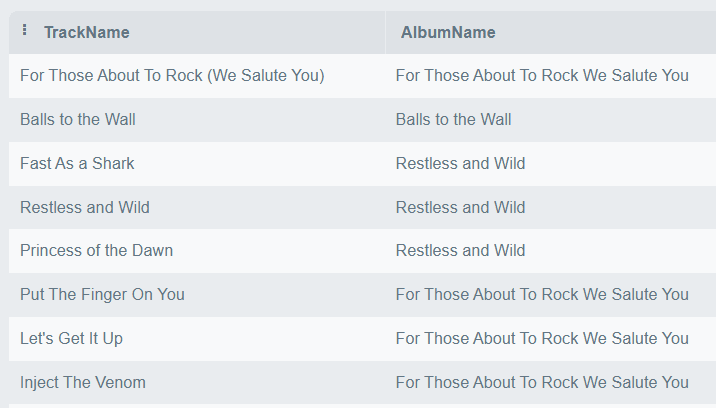
Step 2. สร้าง lazy tibble จากชื่อ table ที่ต้องการ ด้วย dplyr::tbl():
# Create lazy tibble
tracks <- tbl(con,
"Track")
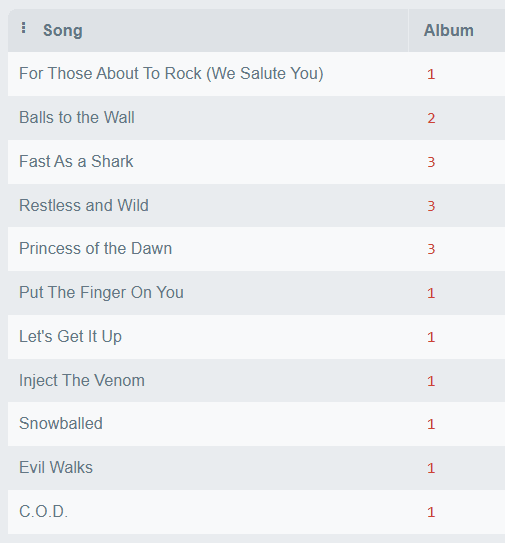
# View tibble
tracks
ผลลัพธ์:
# Source:   table<`Track`> [?? x 9]
# Database: sqlite 3.50.1 [C:\\My Code\\RStudio\\chinook.sqlite]
   TrackId Name           AlbumId MediaTypeId GenreId Composer Milliseconds  Bytes UnitPrice
     <int> <chr>            <int>       <int>   <int> <chr>           <int>  <int>     <dbl>
 1       1 For Those Abo…       1           1       1 Angus Y…       343719 1.12e7      0.99
 2       2 Balls to the …       2           2       1 NA             342562 5.51e6      0.99
 3       3 Fast As a Sha…       3           2       1 F. Balt…       230619 3.99e6      0.99
 4       4 Restless and …       3           2       1 F. Balt…       252051 4.33e6      0.99
 5       5 Princess of t…       3           2       1 Deaffy …       375418 6.29e6      0.99
 6       6 Put The Finge…       1           1       1 Angus Y…       205662 6.71e6      0.99
 7       7 Let's Get It …       1           1       1 Angus Y…       233926 7.64e6      0.99
 8       8 Inject The Ve…       1           1       1 Angus Y…       210834 6.85e6      0.99
 9       9 Snowballed           1           1       1 Angus Y…       203102 6.60e6      0.99
10      10 Evil Walks           1           1       1 Angus Y…       263497 8.61e6      0.99
# ℹ more rows
# ℹ Use `print(n = ...)` to see more rows
.
3️⃣ Create a Query
ในขั้นที่ 3 เราจะเขียน dplyr syntax เพื่อ query table ที่ต้องการ
เช่น สรุปข้อมูลจำนวนเพลง ค่าเฉลี่ยความยาวเพลง (Milliseconds) และขนาดเพลง (Bytes) ของแต่ละ album:
# Create query
album_info <- tracks |>

  # Group by album
  group_by(AlbumId) |>

  # Summarise
  summarise(

    # Number of tracks
    tracks = n(),

    # Average duration
    mean_millisec = mean(Milliseconds,
                         na.rm = TRUE),

    # Total size
    total_bytes = sum(Bytes)
  ) |>

  # Sort by duration
  arrange(desc(mean_millisec))
ตอนนี้ code ของเราจะยังไม่ถูกส่งไปยัง database เพราะ lazy tibble จะเก็บคำสั่งไว้จนกว่าเราจะมีคำสั่งให้ส่ง
เราไปดูคำสั่งที่เราสามารถใช้กับ code ที่ยังไม่ถูกส่งไปกัน
.
4️⃣ Show the Query
เราสามารถใช้ dbplyr::show_query() เพื่อดู SQL ที่จะถูกส่งไปยัง database (ซึ่งแปลงมาจาก dplyr syntax ของเรา) ได้:
# Show query
show_query(album_info)
ผลลัพธ์:
<SQL>
SELECT
  `AlbumId`,
  COUNT(*) AS `tracks`,
  AVG(`Milliseconds`) AS `mean_millisec`,
  SUM(`Bytes`) AS `total_bytes`
FROM `Track`
GROUP BY `AlbumId`
ORDER BY `mean_millisec` DESC
.
5️⃣ Collect the Result
เราสามารถส่ง code เพื่อไป query database ได้ด้วย dbplyr::collect():
# Get result
album_info_tb <- collect(album_info)

# View the result
album_info_tb
ผลลัพธ์:
# A tibble: 347 × 4
   AlbumId tracks mean_millisec total_bytes
     <int>  <int>         <dbl>     <int64>
 1     253     24      2925574. 12872621850
 2     227     19      2778265. 10059916535
 3     229     26      2717907  13917603291
 4     231     24      2637068. 12344960921
 5     226      1      2622250    490750393
 6     228     23      2599142. 11781321607
 7     230     25      2594197.  5280909854
 8     254      1      2484567    492670102
 9     261     17      2321673.  7708725642
10     251     25      1532684.  7652731262
# ℹ 337 more rows
# ℹ Use `print(n = ...)` to see more rows
.
6️⃣ Disconnect the Database
สุดท้าย เมื่อเราทำงานเสร็จแล้ว เราจะปิดการเชื่อมต่อกับ database ด้วย DBI::dbDisconnect():
# Disconnect from database
dbDisconnect(con)
เป็นการจบ loop การทำงานกับ database ด้วย dbplyr
💪 Summary
ในบทความนี้ เราได้ไปทำความรู้จัก 6 ขั้นตอนในการใช้ dbplyr เพื่อทำงานกับ database ในภาษา R กัน:
- Connect to the database:
DBI::dbConnect()และRSQLite::SQLite() - Create a lazy tibble:
dplyr::tbl() - Create a query: ใช้
dplyrsyntax คู่กับ lazy tibble - Show the query:
dbplyr::show_query() - Collect the result:
dbplyr::collect() - Disconnect the database:
DBI::dbDisconnect()
😺 GitHub
ดูตัวอย่าง code และ database ในบทความนี้ได้ที่ GitHub
📃 References
✅ R Book for Psychologists: หนังสือภาษา R สำหรับนักจิตวิทยา
📕 ขอฝากหนังสือเล่มแรกในชีวิตด้วยนะครับ 😆
🙋 ใครที่กำลังเรียนจิตวิทยาหรือทำงานสายจิตวิทยา และเบื่อที่ต้องใช้ software ราคาแพงอย่าง SPSS และ Excel เพื่อทำข้อมูล
💪 ผมขอแนะนำ R Book for Psychologists หนังสือสอนใช้ภาษา R เพื่อการวิเคราะห์ข้อมูลทางจิตวิทยา ที่เขียนมาเพื่อนักจิตวิทยาที่ไม่เคยมีประสบการณ์เขียน code มาก่อน
ในหนังสือ เราจะปูพื้นฐานภาษา R และพาไปดูวิธีวิเคราะห์สถิติที่ใช้บ่อยกัน เช่น:
- Correlation
- t-tests
- ANOVA
- Reliability
- Factor analysis
🚀 เมื่ออ่านและทำตามตัวอย่างใน R Book for Psychologists ทุกคนจะไม่ต้องพึง SPSS และ Excel ในการทำงานอีกต่อไป และสามารถวิเคราะห์ข้อมูลด้วยตัวเองได้ด้วยความมั่นใจ
แล้วทุกคนจะแปลกใจว่า ทำไมภาษา R ง่ายขนาดนี้ 🙂↕️
👉 สนใจดูรายละเอียดหนังสือได้ที่ meb: