Tag: hr

  • สรุป 2 บทเรียนจาก workshop “Compassionate Leadership in the Age of AI” โดยคุณดามพ์ (มงคล หงษ์ชัย) ในงาน PMAT 60th: Compassion และ DEMO — 2 เครื่องมือเพื่อความสำเร็จในการพัฒนา AI solution ในองค์กร

    สรุป 2 บทเรียนจาก workshop “Compassionate Leadership in the Age of AI” โดยคุณดามพ์ (มงคล หงษ์ชัย) ในงาน PMAT 60th: Compassion และ DEMO — 2 เครื่องมือเพื่อความสำเร็จในการพัฒนา AI solution ในองค์กร

    ในบทความนี้ ผมจะมาสรุปเนื้อหาจาก workshop “Compassionate Leadership in the Age of AI” ของคุณดามพ์ (มงคล หงษ์ชัย) ผู้เชี่ยวชาญ agile leadership และ AI for future skills ในงาน PMAT 60th เมื่อวันที่ 12 พ.ย. ที่ผ่านมา

    โดยเนื้อหาจะแบ่งเป็น 3 ส่วน ได้แก่:

    1. Issues with AI adoption: ปัญหาการพัฒนา AI solution
    2. Compassion: เครื่องมือทำความเข้าใจคน
    3. DEMO: เครื่องมือทำความเข้าใจ process

    ถ้าพร้อมแล้ว ไปเริ่มกันเลย


    1. 😭 The Issue With AI Solutions
    2. 🫂 Compassion: Tool for Understanding the People
      1. ❤️ Empathy
      2. 🫂 Compassion
      3. 🧘 How to Develop Compassion
    3. 🦾 DEMO: Tool for Understanding Process
      1. 📊 Why DEMO?
      2. 👷 What Is DEMO?
      3. 🤖 DEMO & AI Solution
      4. 📋 How to DEMO
    4. 💪 Summary
    5. 📚 Further Reading

    😭 The Issue With AI Solutions

    95% ขององค์กรล้มเหลวในการสร้าง AI solution ที่สร้างกำไรได้จริง (The GenAI Divide: State of AI in Business 2025)

    สาเหตุหลักของความล้มเหลวมีอยู่ 2 ข้อ ได้แก่:

    1. People: ขาดความเข้าใจในผู้ที่เกี่ยวข้องกับการเปลี่ยนแปลง (เช่น พนักงานที่ต้องใช้ AI)
    2. Process: ขาดความเข้าใจใน process งานที่นำ AI มาประยุกต์ใช้

    ซึ่งทำให้ AI solution ที่ออกแบบไม่ตอบโจทย์คนใช้งานและไม่สามารถสร้างรายได้ให้กับองค์กรได้

    เราสามารถแก้ทั้ง 2 สาเหตุนี้ได้ด้วย 2 เครื่องมือนี้:

    1. Compassion: ช่วยทำความเข้าใจคน
    2. DEMO: ช่วยทำความเข้าใจ process

    🫂 Compassion: Tool for Understanding the People

    .

    ❤️ Empathy

    ถ้าเราจะเข้าใจคนอื่นได้ เราจะต้องมี empathy

    Empathy เป็นคำที่มีคนพูดถึงอยู่บ่อย ๆ โดยเฉพาะในองค์กรที่ทำงานกับ design thinking ซึ่งใช้ empathy เป็นเครื่องมือหลักในการทำความเข้าใจปัญหาของ user เพื่อออกแบบ solution ที่ตอบโจทย์ user อย่างแท้จริง

    Empathy ยังเป็น 1 ใน 4 ลักษณะสำคัญของ leader ในยุค VUCA (volatile, uncertain, complex, ambiguous) เคียงข้างกับ problem solving, relationship management, และ motivation อีกด้วย

    Empathy เป็นสิ่งจำเป็น เพราะทำให้เราเข้าใจความรู้สึกและมุมมองของคนอื่นได้ เพราะ leader ที่ไม่มี empathy จะไม่สามารถ engage คนอื่นได้ เพราะไม่สามารถสร้าง motivation ให้กับคนอื่นได้ (Connect with Empathy, But Lead with Compassion)

    แต่ empathy อย่างเดียวอาจไม่พอ และสิ่งที่เราต้องการจริง ๆ คือ compassion

    .

    🫂 Compassion

    ในขณะที่ empathy ช่วยให้เรารับรู้ความรู้สึกและมุมมองของคนอื่น compassion ไม่เพียงแต่ช่วยให้เราเข้าถึงความรู้สึกของคนอื่น แต่ยังรวมไปถึงความต้องการที่จะช่วยคนอื่นอีกด้วย

    Compassion แปลไทยได้ว่า “กรุณา” ซึ่งหมายถึง การช่วยให้คนอื่นพ้นทุกข์ และคำที่มักมาคู่กัน คือ “เมตตา” ซึ่งแปลว่า การทำให้คนอื่นมีความสุข (Buddhist beliefs – Edexcel)

    Empathy เป็นสิ่งจำเป็นที่จะช่วยให้เรา connect กับคนอื่นได้ แต่ถ้าเราจะเป็น leader ที่ดี เราจะต้องมี compassion ด้วย เพราะ empathy อย่างเดียวอาจทำให้เราตัดสินใจผิดพลาดได้ ตามคำของ Paul Polman อดีต CEO ของ Unilever:

    If I led with empathy, I would never be able to make a single decision. Why? Because with empathy, I mirror the emotions of others, which makes it impossible to consider the greater good.”

    แปล:

    ถ้าผมนำด้วย empathy ผมจะตัดสินใจไม่ได้สักอย่าง ทำไมหรอ? เพราะ empathy ทำให้ผมรู้สึกความรู้สึกของคนอื่น ซึ่งทำให้ผมคิดถึงประโยชน์ของส่วนรวมไม่ได้

    มีงานวิจัยที่แสดงให้เห็นถึงข้อเสียของ empathy

    ในงานวิจัย ผู้เข้าร่วมถูกขอให้เลือกว่า จะลัดคิวเด็กที่ป่วยหนักคนหนึ่งเพื่อให้ได้รับการรักษาก่อนคิวไหม โดยกลุ่มหนึ่งถูกขอให้ฟังและมีความรู้สึกร่วมในขณะที่เด็กเล่าถึงความเจ็บปวดจากโรค และอีกกลุ่มถูกขอให้ฟังโดยไม่ตัดสิน

    ผู้เข้าร่วมกลุ่มแรกเลือกที่จะลัดคิวให้เด็กมากกว่าผู้เข้าร่วมในกลุ่มหลัง แม้ว่าผู้เชี่ยวชาญด้านการแพทย์จะคัดค้าน แม้ว่าการตัดสินใจลัดคิวจะเป็นผลดีต่อเด็ก แต่ทำให้ผู้ป่วยอื่น ๆ ที่อาจต้องการการรักษามากกว่าอยู่ในอันตรายได้ (Connect with Empathy, But Lead with Compassion)

    ดังนั้น เราไม่ควรมีแต่ empathy แต่ควรมี compassion ด้วย

    .

    🧘 How to Develop Compassion

    เราสามารถพัฒนา compassion ได้ 2 วิธี:

    วิธีที่ 1. ฝึกอยู่กับปัจจุบันทั้งกายและใจ

    แม้ว่าเวลาคุยกับคนอื่น เราอาจจะคิดว่าเราฟังอยู่ แต่จริง ๆ แล้วใจเราอาจไปอยู่ที่อื่น หรือเสียงในหัวเราอาจจะดังกลบเสียงคนที่กำลังพูด

    เราสามารถฝึก compassion ได้โดยกลับมาอยู่กับสิ่งที่เกิดขึ้นในปัจจุบัน ซึ่งจะช่วยให้เราอยู่กับสิ่งที่คนอื่นกำลังพูดได้มากขึ้น

    เราสามารถฝึกอยู่กับปัจจุบันได้ผ่านการนั่งสมาธิ หรือง่ายกว่านั้น คือ การสังเกตสิ่งที่กำลังเกิดขึ้นรอบตัวเรา เช่น:

    • ลมหายใจเข้าออกของเรา
    • ผิวของเนื้อผ้าที่เราสวมใส่
    • แอร์หรือลมที่ตกกระทบผิวของเรา

    แค่เราฝึกสังเกตสิ่งที่เกิดขึ้นในแต่ละช่วงขณะ เราก็จะค่อย ๆ พัฒนา compassion ของเราขึ้นทีละนิด เพราะเราสามารถอยู่กับคนที่ต้องการความช่วยเหลือจากทั้งกายและใจ

    วิธีที่ 2. ให้ AI ช่วย

    เราสามารถให้ AI ช่วยพัฒนา compassion ได้ เช่น:

    • เล่าสถานการณ์ที่เราพูดคุยกับคนอื่นให้ AI ฟัง เพื่อให้ AI ให้มุมมองใหม่ ๆ กับเรา พร้อมแนะนำวิธีแสดง compassion เพิ่มเติมได้ (Using AI to Make You a More Compassionate Leader)
    • ให้ AI ช่วย role-play กับเรา ให้เราได้ฝึก compassion เหมือนในหน้างานจริง

    🦾 DEMO: Tool for Understanding Process

    .

    📊 Why DEMO?

    ทุกองค์กรมี chart มากมายสำหรับแสดงข้อมูลต่าง ๆ เช่น flow chart สำหรับแสดงขั้นตอนการทำงานในองค์กร และ organisation chart ที่แสดงผังองค์กร

    Chart เหล่านี้ล้วนแสดงข้อมูลเป็นท่อน ๆ นั่นคือ แสดงรายละเอียดภาพย่อย แต่ขาดความเชื่อมโยงระหว่างข้อมูลที่สำคัญต่อการตัดสินใจในระดับบริหาร

    ยกตัวอย่างเช่น flow chart แสดงการเบิกจ่ายค่าเดินทางให้พนักงาน:

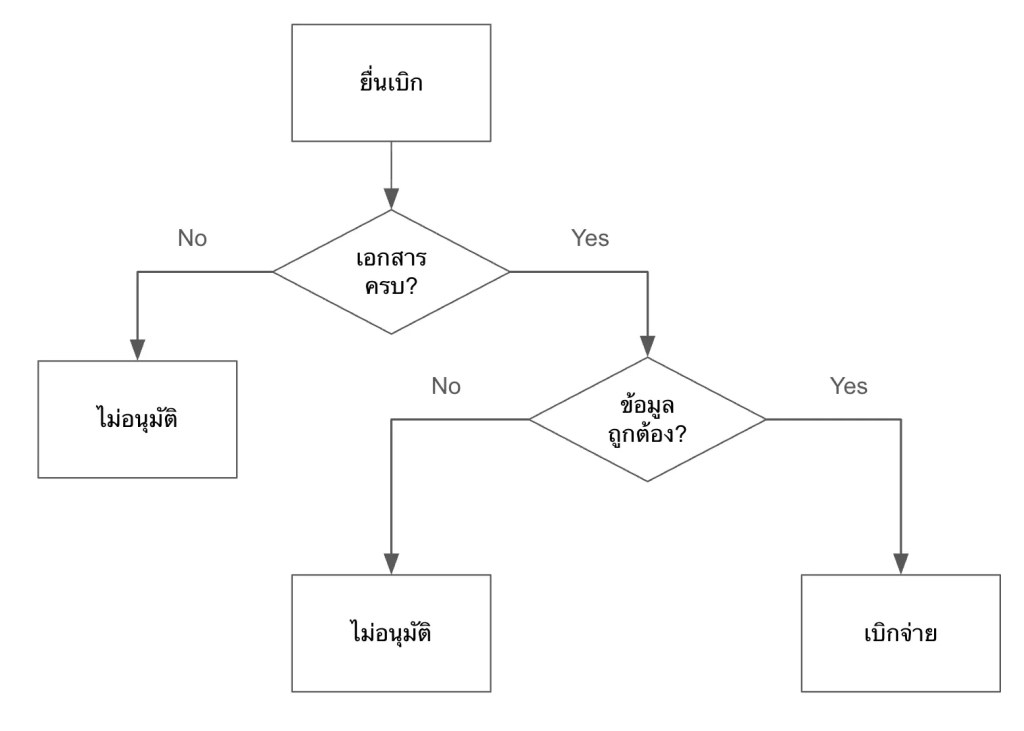
    ในรูป เราจะรู้ว่ามีขั้นตอนอะไรบ้างที่จะเกิดขึ้นก่อนพนักงานจะได้รับเงินค่าเดินทาง แต่เราไม่รู้ว่าขั้นตอนเหล่านี้เกี่ยวข้องกับส่วนอื่น ๆ ขององค์กรยังไงบ้าง เช่น:

    • แต่ละขั้นตอนมีใครเกี่ยวข้องบ้าง
    • มีเอกสารอะไรที่ต้องการใช้บ้าง
    • แต่ละขั้นตอนใช้เวลาเท่าไร

    ถ้าเราต้องการเห็นภาพรวมของการทำงานในองค์กร เราจะใช้ DEMO

    .

    👷 What Is DEMO?

    DEMO (ย่อมาจาก Design & Engineering Methodology for Organisations) เป็นหลักการในการออกแบบองค์กร ซึ่งมีวิธีการเขียน process ในระดับ high level ที่ช่วยให้ทำความเข้าใจและตัดสินใจได้ง่าย

    ยกตัวอย่างการเขียน process การเบิกค่าเดินทางแบบ DEMO:

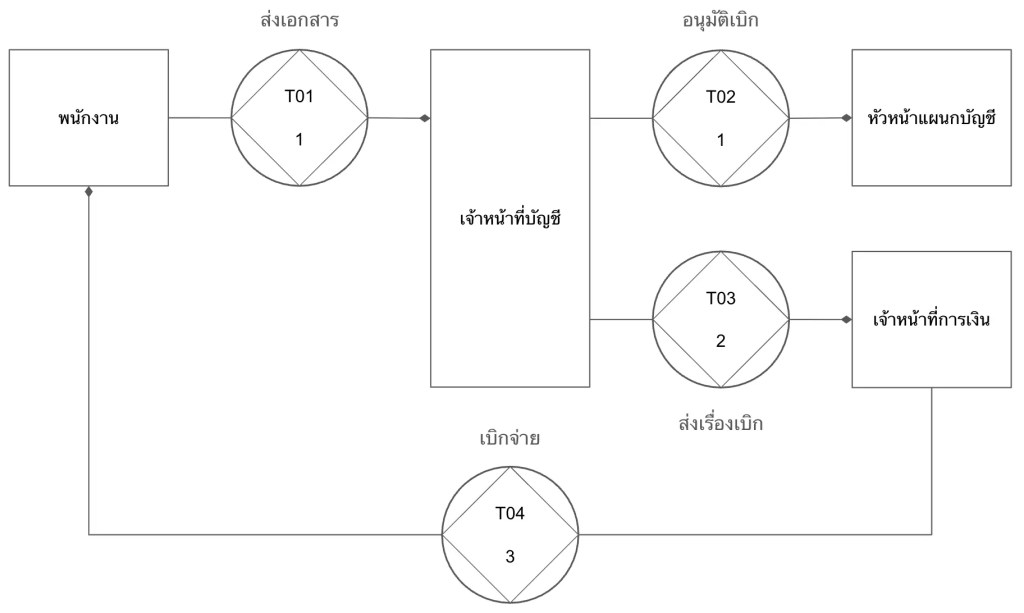
    DEMO แสดง process ในรูปแบบของ transaction หรือการแลกเปลี่ยนระหว่าง 2 ฝ่าย ได้แก่:

    1. Initiator: คนที่เริ่มการแลกเปลี่ยน (เช่น พนักงานที่ขอเบิกค่าเดินทาง)
    2. Executor: คนที่ทำให้เกิดผลลัพธ์บางอย่างในระบบ (เช่น ฝ่ายบัญชีที่อนุมัติจ่าย)

    ในแผนภาพแบบ DEMO (เรียกว่า OCD หรือ Organisation Construction Diagram) เราจะเห็นว่า:

    1. การเบิกจ่ายเงินมีกี่ transaction (ดูจาก T01, T02, …)
    2. แต่ละ transaction มีใครที่เกี่ยวข้องบ้าง
    3. แต่ละ transaction ใช้เวลาเท่าไร (ตัวเลขใต้ T0x เช่น T01 ใช้เวลา 1 วัน)

    OCD มาพร้อมกับตารางที่ให้ข้อมูลเพิ่มเติมเกี่ยวกับ transaction เช่น:

    TransactionDurationDocuments
    T01. ส่งเอกสาร1 วันฟอร์มเบิกค่าเดินทาง, หลักฐานการเดินทาง, สำเนาบัตรประชาชน
    T02. อนุมัติเบิก1 วันฟอร์มเบิกค่าเดินทาง, หลักฐานการเดินทาง
    T03. ส่งเรื่องเบิก2 วันฟอร์มเบิกค่าเดินทาง, หลักฐานการเดินทาง
    T04. เบิกจ่าย3 วันอีเมลแจ้งการเบิกจ่าย

    เมื่อเราดู OCD และตารางประกอบกัน เราจะสามารถระบุปัญหาและจุดที่ควรแก้ไขได้ในทันที เช่น:

    1. เราตัดขั้นตอน T03 ออกได้ไหม? ให้ฝ่ายบัญชีจ่ายตรงให้พนักงานเลย
    2. ทำไม T03 ใช้เวลานาน? ลดเหลือ 1 วันได้ไหม?
    3. T01 ต้องใช้เอกสาร 3 อย่างเลยหรอ? ตัดสำเนาบัตรประชาชนออกได้หรือเปล่า?

    ถ้าเรามองย้อนกลับไปที่ flow chart ก่อนหน้านี้ เราจะเห็นความแตกต่างอย่างชัดเจนว่า เราไม่สามารถตั้งคำถามเหล่านี้ได้ในทันที เพราะ flow chart ไม่ได้ให้ข้อมูลที่เพียงพอหรือจำเป็นต่อการตัดสินใจในการเปลี่ยนแปลง process งาน

    ในทางตรงกันข้าม OCD สามารถให้ข้อมูลที่ช่วยให้เราทำความเข้าใจ process และระบุปัญหาที่ควรแก้ไขได้ในทันที

    .

    🤖 DEMO & AI Solution

    เราสามารถนำ DEMO มาประยุกต์ใช้ในการออกแบบ AI solution ให้เหมาะกับองค์กรได้

    ยกตัวอย่างเช่น สำหรับการเบิกค่าเดินทาง เราอาจจะอยากพัฒนา AI ขึ้นมาช่วยพนักงานยื่นเอกสารเบิกจ่าย (T01) แต่จะเห็นได้ว่า ถ้าเราทุ่มงบประมาณไปกับการพัฒนา AI ในส่วนนี้ เราจะลดภาระงานไปเพียง 1 วันเท่านั้น

    แต่ถ้าเราพัฒนา AI เพื่อมาช่วยฝ่ายบัญชีส่งต่อเอกสารให้กับฝ่ายการเงิน (T03) หรือช่วยฝ่ายการเงินตั้งจ่ายและส่งอีเมลยืนยันการจ่าย (T04) เราจะสามารถลดเวลาได้มากขึ้น เพราะทั้ง 2 จุดนี้ใช้เวลามากที่สุดในขั้นตอนทั้งหมด ถ้าเราพัฒนา AI เพื่อช่วย T03 และ T04 แล้ว เราจะลดเวลาในการทำงานลงไปกว่าครึ่งของ process ทั้งหมด (5 จาก 7 วัน)

    .

    📋 How to DEMO

    การเขียน OCD มีอยู่ 3 ขั้นตอน ได้แก่:

    1. Gather data: เก็บข้อมูล process งานจากฝ่ายที่เกี่ยวข้อง (เช่น ฝ่ายบัญชี) โดยใช้ empathy และ compassion เพื่อช่วยให้เราเข้าใจและอยากช่วยเหลือ
    2. Categorise data: จัดกลุ่มข้อมูลได้เป็น 3 ส่วน ได้แก่:
      1. Forma: วิธีการสื่อสาร (เช่น อีเมล, แบบฟอร์ม)
      2. Informa: สิ่งที่ต้องการสื่อสาร (เช่น คำขออนุมัติเบิกค่าเดินทาง)
      3. Performa: สิ่งที่ทำให้เกิดผลลัพธ์ (เช่น การอนุมัติเบิก)
    3. Convert to transaction: เปลี่ยนข้อมูลให้เป็น transaction ที่มี 3 องค์ประกอบ ได้แก่:
      1. Actors: initiator และ executor
      2. Documents: เอกสารที่เกี่ยวข้อง (เช่น ฟอร์มเบิกค่าเดินทาง, ใบเสร็จ)
      3. Duration: ระยะเวลาที่ใช้สำหรับ transaction นั้น ๆ (เช่น 1 วัน)

    💪 Summary

    องค์กรส่วนใหญ่ล้มเหลวในการพัฒนา AI solution ให้ตอบโจทย์ เพราะขาดความเข้าใจ 2 อย่าง ได้แก่:

    1. People: ความเข้าใจในคนที่เกี่ยวข้อง
    2. Process: ความเข้าใจในกระบวนการทำงานที่จะเอา AI solution เข้าไปช่วย

    เราสามารถแก้ทั้ง 2 สาเหตุนี้ได้ โดยใช้:

    1. Compassion เพื่อทำความเข้าใจคน
    2. DEMO เพื่อทำความเข้าใจกระบวนการทำงาน

    📚 Further Reading

    สำหรับคนที่สนใจศึกษาเชิงลึกเกี่ยวกับหัวข้อในบทความนี้ สามารถอ่านเพิ่มเติมได้ตามนี้

    Compassion:

    DEMO:

    Bonus — สรุปงาน PMAT 60th:

  • วิเคราะห์ resumes ใน 3 ขั้นตอน ด้วย Gemini ผ่าน OpenAI library ใน Python — ตัวอย่างการทำงานใน Google Colab

    วิเคราะห์ resumes ใน 3 ขั้นตอน ด้วย Gemini ผ่าน OpenAI library ใน Python — ตัวอย่างการทำงานใน Google Colab

    บทความนี้เหมาะสำหรับบริษัทหรือ HR ที่ต้องการใช้ AI ช่วยลดเวลาในการคัดกรองผู้สมัคร เพราะเราจะมาดูวิธีวิเคราะห์ resumes ด้วย Gemini ผ่าน OpenAI library ใน Python กัน

    บทความนี้แบ่งเป็น 3 ส่วนตามขั้นตอนการวิเคราะห์ ได้แก่:

    1. Install and load libraries
    2. Set input
    3. Analyse resumes

    โดยเราจะไปดูตัวอย่างโดยใช้ Google Colab กัน (ดู code ทั้งหมดได้ที่นี่)

    ถ้าพร้อมแล้ว ไปเริ่มกันเลย


    1. ⬇️ 1. Install & Load Libraries
    2. 🔧 2. Set the Input
      1. 🧑‍💻 (1) Client
      2. 💼 (2) JD
      3. 📄 (3) Resumes
    3. ⚡ 3. Analyse the Resumes
      1. 🤖 (1) Function เรียกใช้งาน Gemini
      2. ➕ (2) Function ใส่ Input ใน Prompt
      3. 🤔 (3) วิเคราะห์ Resumes
      4. 👀 (4) Print ผลลัพธ์
    4. 😺 Code & Input Examples
    5. 📃 References

    ⬇️ 1. Install & Load Libraries

    ในขั้นแรก เราจะเรียกติดตั้งและโหลด libraries ที่จำเป็นดังนี้:

    • openai: สำหรับเรียกใช้ AI ผ่าน API
    • drive จาก google.colab: สำหรับเชื่อมต่อกับไฟล์ใน Google Drive
    • PyPDF2: สำหรับดึง text ออกจากไฟล์ PDF
    • textwrap: สำหรับลบย่อหน้าออกจาก string
    • Console จาก rich.console และ Markdown จาก rich.markdown: สำหรับ render การแสดงผล string ให้อ่านง่ายขึ้น

    ติดตั้ง:

    # Install libraries
    !pip install PyPDF2
    

    Note: Google Colab มี libraries อื่น ๆ อยู่แล้ว ทำให้เราแค่ต้องติดตั้ง PyPDF2 อย่างเดียว

    โหลด:

    # Load libraries
    
    # Connect to Gemini
    from openai import OpenAI
    
    # Connect to Google Drive
    from google.colab import drive
    
    # Extract text from PDF
    import PyPDF2
    
    # Dedent text
    import textwrap
    
    # Render markdown text
    from rich.console import Console
    from rich.markdown import Markdown
    

    🔧 2. Set the Input

    สำหรับการวิเคราะห์ resumes เราต้องการ input 3 อย่าง ได้แก่:

    1. Client: สำหรับเรียกใช้ Gemini API
    2. Job description (JD): รายละเอียดตำแหน่งงานที่กำลังต้องการพนักงาน
    3. Resumes: ข้อมูล resume ที่เราต้องการวิเคราะห์

    เราไปดูวิธีกำหนด input แต่ละตัวกัน

    .

    🧑‍💻 (1) Client

    เราสามารถกำหนด client ได้ด้วย OpenAI() ซึ่งต้องการ 2 arguments:

    1. api_key: API key สำหรับเชื่อมต่อ API
    2. base_url: base URL สำหรับเรียกใช้ AI service ซึ่งสำหรับ Gemini เราต้องกำหนดเป็น "<https://generativelanguage.googleapis.com/v1beta/openai/>"

    ในตัวอย่าง เราจะเรียกใช้ OpenAI() แบบนี้:

    # Create a client
    client = OpenAI(api_key="YOUR_API_KEY", base_url="<https://generativelanguage.googleapis.com/v1beta/openai/>")
    

    Note: ในกรณีใช้งานจริง ให้แทนที่ "YOUR_API_KEY" ด้วย API key จริง (ดูวิธีสร้าง API key ฟรีได้ที่ Using Gemini API keys)

    .

    💼 (2) JD

    Input ที่ 2 สำหรับการวิเคราะห์ คือ JD ซึ่งเราสามารถกำหนดเป็น string ได้แบบนี้:

    # Set the job description (JD)
    web_dev_jd = """
    Senior Web Developer
    
    We're looking for a Senior Web Developer with a strong background in front-end development and a passion for creating dynamic, intuitive web experiences. The ideal candidate will have extensive experience with the entire development lifecycle, from project conception to final deployment and quality assurance. This role requires a blend of technical skill, creative collaboration, and a commitment to solving complex programming challenges.
    
    Responsibilities
    * Cooperate with designers to create clean, responsive interfaces and intuitive user experiences.
    * Develop and maintain project concepts, ensuring an optimal workflow throughout the development cycle.
    * Work with a team to manage large, complex design projects for corporate clients.
    * Complete detailed programming tasks for both front-end and back-end server code.
    * Conduct quality assurance tests to discover errors and optimize usability for all projects.
    
    Qualifications
    * Bachelor's degree in Computer Information Systems or a related field.
    * Proven experience in all stages of the development cycle for dynamic web projects.
    * Expertise in programming languages including PHP OOP, HTML5, JavaScript, CSS, and MySQL.
    * Familiarity with various PHP frameworks such as Zend, Codeigniter, and Symfony.
    * A strong background in project management and customer relations.
    """
    

    Note: ในกรณีที่ JD เป็นไฟล์ PDF เราสามารถใช้วิธีดึงข้อมูลแบบเดียวกันกับ resumes ได้

    .

    📄 (3) Resumes

    Input สุดท้าย คือ resumes ที่เราต้องการวิเคราะห์

    ในตัวอย่าง เราจะดึงข้อมูล resumes จากไฟล์ PDF ใน Google Drive ใน 3 ขั้นตอน ได้แก่:

    ขั้นที่ 1. เชื่อมต่อ Google Drive ด้วย drive.mount():

    # Connect to Google Drive
    drive.mount("/content/drive")
    

    Note: Google จะถามยืนยันการให้สิทธิ์เข้าถึงไฟล์ใน Drive ให้เรากดยืนยันเพื่อไปต่อ

    ขั้นที่ 2. กำหนด file path ของไฟล์ PDF ใน Google Drive:

    # Set resume file paths
    rs_file_paths = {
        "George Evans": "/content/drive/My Drive/Resumes/cv_george_evans.pdf",
        "Robert Richardson": "/content/drive/My Drive/Resumes/cv_robert_richardson.pdf",
        "Christine Smith": "/content/drive/My Drive/Resumes/cv_christine_smith.pdf"
    }
    

    Note: ในตัวอย่าง จะเห็นว่า เรามี resumes 3 ใบ (ดาวน์โหลด resumes ฟรีได้ที่ www.coolfreecv.com)

    ขั้นที่ 3. ดึง text ออกจาก resumes ด้วย for loop และ PyPDF2:

    # Extract resume texts
    
    # Instantiate a collector
    rs_texts = {}
    
    # Loop through resume files to get text
    for key in rs_file_paths:
    
        # Instantiate an empty string to store the extracted text
        rs_text = ""
    
        # Open the PDF file
        reader = PyPDF2.PdfReader(rs_file_paths[key])
    
        # Loop through the pages
        for i in range(len(reader.pages)):
    
            # Extract the text from the page
            text = reader.pages[i].extract_text()
    
            # Append the text to the string
            rs_text += text
    
        # Collect the extracted text
        rs_texts[key] = rs_text
    

    ตัวอย่าง PDF และข้อมูลที่ดึงจาก PDF:

    Source: www.coolfreecv.com
    Contact  
    +1 (970) 343  888 999 
    george.evans@gmail.com  
    <https://www.coolfreecv.com>  
    32 ELM STREET MADISON, SD 
    57042  
     George  Evans  
    PHP / OOP   
    Zend Framework  Summary  
    Senior Web Developer specializing in front end development . 
    Experienced with all stages of the development cycle for dynamic 
    web projects. Well -versed in numerous programming languages 
    including HTML5, PHP OOP, JavaScript, CSS, MySQL. Strong 
    background in project management and customer relations. 
    Perceived as versatile, unconventional and committed, I am 
    looking for new and interesting programming challenges.  
    Experience  
    Web Developer - 09/201 8 to 05/20 22 
    Luna Web Design, New York  
    • Cooperate with designers to create clean interfaces and 
    simple, intuitive interactions and experiences.  
    • Develop project concepts and maintain optimal workflow.  
    • Work with senior developer to manage large, complex 
    design projects for corporate clients.  
    • Complete detailed programming and development tasks 
    for front end public and internal websites as well as 
    challenging back -end server code.  
    • Carry out quality assurance tests to discover errors and 
    optimize usability.  
    Education  
    Bachelor of Science: Computer Information Systems  - 2018  
    Columbia University, NY  
     
    Certifications  
    PHP Framework (certificate): Zend, Codeigniter, Symfony. 
    Programming Languages: JavaScript, HTML5, PHP OOP, CSS, SQL, 
    MySQL.  
    Reference  
    Adam Smith - Luna Web Design  
    adam.smith@luna.com  +1(970 )555 555  Skills   
    JavaScript   Symfony Framework
    

    ⚡ 3. Analyse the Resumes

    ในขั้นสุดท้าย เราจะเปรียบเทียบความเหมาะสมของ resumes กับตำแหน่งงาน (JD) ใน 4 ขั้นตอน ดังนี้:

    1. สร้าง function เพื่อเรียกใช้ Gemini
    2. สร้าง function เพื่อใส่ input ใน prompt
    3. วิเคราะห์ resumes โดยใช้ for loop และ functions จากข้อ 1, 2
    4. Print ผลการวิเคราะห์

    .

    🤖 (1) Function เรียกใช้งาน Gemini

    ในขั้นแรก เราจะสร้าง function สำหรับเรียกใช้ Gemini เพื่อให้ง่ายในการใช้งาน AI

    ในตัวอย่าง เราจะกำหนด 3 arguments สำหรับ function:

    1. prompts: list เก็บ system prompt และ user prompt
    2. model: model ของ Gemini ที่เราจะเรียกใช้ (เช่น Gemini 2.5 Flash)
    3. temp: ระดับความคิดสร้างสรรค์ของ model โดยมีค่าระหว่าง 0 และ 2 โดย 0 จะทำให้ model ให้คำตอบเหมือนกันทุกครั้ง และ 2 คำตอบจะแตกต่างกันทุกครั้ง
    # Create a function to get a Gemini response
    def get_gemini_response(prompts, model, temp):
    
        # Generate a response
        response = client.chat.completions.create(
    
            # Set the prompts
            messages=prompts,
    
            # Set the model
            model=model,
    
            # Set the temperature
            temperature=temp
        )
    
        # Return the response
        return response.choices[0].message.content
    

    .

    ➕ (2) Function ใส่ Input ใน Prompt

    ในขั้นที่ 2 เราจะสร้าง function เพื่อประกอบ input เข้ากับ prompt เพื่อพร้อมที่จะนำไปใช้ใน function ในขั้นที่ 1

    ในตัวอย่างเราจะสร้าง function แบบนี้:

    # Create a function to concatenate prompt + JD + resume
    def concat_input(jd_text, rs_text):
    
        # Set the system prompt
        system_prompt = """
        # 1. Your Role
        You are an expert technical recruiter and resume analyst.
        """
    
        # Set the user prompt
        user_prompt = f"""
        # 2. Your Task
        Your task is to meticulously evaluate a candidate's resume against a specific job description (JD) and provide a detailed pre-screening report.
    
        Your analysis must be structured with the following sections and include specific, data-driven insights.
    
        ## 1. Strengths
        - Identify and elaborate on top three key strengths.
        - For each strength, briefly provide specific evidence from the resume (e.g., "The candidate's experience with Python and Django, as shown in their role at Acme Corp, directly addresses the JD's requirement for...") and explain how it directly fulfills a requirement in the JD.
    
        ## 2. Weaknesses
        - Identify top three areas where the candidate's experience or skills may not fully align with the JD's requirements.
        - For each point, briefly explain the potential concern and why it might be a risk for the role (e.g., "The JD requires experience with AWS, but the resume only mentions exposure to Azure. This could indicate a gap in cloud infrastructure expertise.").
    
        ## 3. Candidate Summary
        - Draft a concise summary of the candidate's professional background.
        - Emphasise their JD-relevant core responsibilities, key achievements, and career progression as evidenced in the resume.
    
        ## 4. Overall Fit Score
        - Provide a numerical score from 1 to 100, representing the overall alignment of the candidate's profile with the JD.
        - A higher score indicates a stronger match: 80-100 = best match; 60-80 = strong match; 0-40 = weak match.
    
        ## 5. Hiring Recommendation
        - Conclude with a clear, binary hiring recommendation: "🟢 Proceed to interview", "🟡 Add to waitlist", or "🔴 Do not proceed".
        - Justify this recommendation with a brief, objective explanation based on the analysis above.
    
        ---
    
        # 3. Your Output
        - Use a professional and objective tone.
        - Base your analysis solely on the provided resume and JD. Do not make assumptions.
        - Be concise and to the point; no more than 30 words per sentence; the hiring manager needs to quickly grasp the key findings.
        - Format your final report using markdown headings and bullet points for readability.
    
        Output template:
        '''
        # [candidate's name (Title Case)] ([fit score]/100)
    
        [recommendation]: [justification]
    
        ## Profile Summary:
        [summary]
    
        ## Strengths:
        - [strength 1]
        - [strength 2]
        - [strength 3]
    
        ## Weaknesses:
        - [weakness 1]
        - [weakness 2]
        - [weakness 3]
        '''
    
        ---
    
        # 4. Your Input
        **1. JD:**
        {jd_text}
    
        **2. Resume:**
        {rs_text}
    
        ---
    
        Generate the report.
        """
    
        # Collect prompts
        prompts = [
            {
                "role": "system",
                "content": textwrap.dedent(system_prompt)
            },
            {
                "role": "user",
                "content": textwrap.dedent(user_prompt)
            }
        ]
    
        # Return the prompts
        return prompts
    

    Note: เราใช้ textwrap.dedent() เพื่อลบย่อหน้าที่เกิดจาก indent ใน function ออกจาก prompt เพื่อป้องกันความผิดพลาดในการประมวลผลของ AI และประหยัด input token

    .

    🤔 (3) วิเคราะห์ Resumes

    ในขั้นที่ 3 ซึ่งเป็นขั้นที่สำคัญที่สุด เราจะวิเคราะห์ resumes โดย:

    • ใช้ functions จากขั้นที่ 1 และ 2 เพื่อสร้าง prompt และส่ง prompt ให้กับ Gemini
    • ใช้ for loop เพื่อส่ง resumes ให้กับ Gemini จนครบทุกใบ
    # Instantiate a response collector
    results = {}
    
    # Loop through the resumes
    for rs_name, rs_text in rs_texts.items():
    
        # Create the prompts
        prompts = concat_input(web_dev_jd, rs_text)
    
        # Get the Gemini response
        response = get_gemini_response(prompts=prompts, model="gemini-2.5-flash", temp=0.5)
    
        # Collect the response
        results[rs_name] = response
    

    เมื่อรัน code นี้แล้ว เราจะได้ผลลัพธ์เก็บไว้ใน results

    .

    👀 (4) Print ผลลัพธ์

    สุดท้าย เราจะ print ผลการวิเคราะห์ออกมา โดย:

    • ใช้ for loop ช่วย print ผลจนครบ
    • ใช้ Console กับ Markdown เพื่อทำให้ข้อความอ่านง่ายขึ้น:
    # Instantiate a console
    console = Console()
    
    # Instantiate a counter
    i = 1
    
    # Print the results
    for rs_name, analysis_result in results.items():
    
        # Print the resume name
        print(f"👇 {i}. {rs_name}:")
    
        # Print the response
        console.print(Markdown(analysis_result))
    
        # Add spacers and divider
        print("\\n")
        print("-----------------------------------------------------------")
        print("\\n")
    
        # Add a counter
        i += 1
    

    ตัวอย่างผลลัพธ์:

    ในตัวอย่าง จะเห็นได้ว่า George Evans เหมาะที่จะเป็น Senior Web Developer


    😺 Code & Input Examples

    • ดูตัวอย่าง code ได้ที่ Google Colab
    • ดูตัวอย่าง JD และ resumes ได้ที่ JD & Resumes

    📃 References

  • เล่นกับข้อมูลง่าย ๆ ด้วย 5 functions จาก dplyr: วิธีใช้งาน dplyr เบื้องต้น พร้อมตัวอย่างการทำงานกับข้อมูล HR

    เล่นกับข้อมูลง่าย ๆ ด้วย 5 functions จาก dplyr: วิธีใช้งาน dplyr เบื้องต้น พร้อมตัวอย่างการทำงานกับข้อมูล HR

    1. 💻 ภาษา R
    2. 🔢 dplyr: Library สำหรับหมุนข้อมูล
    3. 🧑‍💼 ตัวอย่างข้อมูล HR
    4. ✍️ Pattern การเขียน Function
    5. 1️⃣ Function #1: select()
    6. 2️⃣ Function #2: filter()
    7. 3️⃣ Function #3: arrange()
    8. 4️⃣ Function #4: summarise()
    9. 5️⃣ Function #5: mutate()
    10. 🫂 Put Everything Together: Pipe Operator
    11. 🔥 สรุป 5 Functions จาก dplyr
    12. 💪 Try It Yourself
    13. 📚 อ่านเพิ่มเติมเกี่ยวกับ dplyr
    14. ✅ R Book for Psychologists: หนังสือภาษา R สำหรับนักจิตวิทยา

    💻 ภาษา R

    R เป็นภาษาคอมพิวเตอร์ที่ออกแบบมาเพื่อทำงานกับ data เหมาะกับสายงานที่ต้องทำงานกับ data เช่น

    • Researcher ที่ต้องการวิเคราะห์ลักษณะกลุ่มตัวอย่าง เช่น จำนวนตัวอย่างแบ่งตามเพศ หรือช่วงอายุ
    • Data analyst ที่ต้องการหา insight จากข้อมูลขององค์กร เช่น วิเคราะห์แนวโน้มทางธุรกิจ
    • Sale ที่ต้องการวิเคราะห์ข้อมูลการขาย เช่น จำนวนลูกค้า ยอดขาย และกำไร
    • หรือแม้แต่ HR ที่ต้องการทำข้อมูลพนักงาน เช่น วิเคราะห์ performance, engagement, และ job satisfaction

    🔢 dplyr: Library สำหรับหมุนข้อมูล

    R มี built-in functions และ libraries หลากหลายที่รองรับการทำงานกับ data ในรูปแบบต่าง ๆ ซึ่งหนึ่งใน libraries ที่นิยมใช้กัน ได้แก่ dplyr

    dplyr เป็น library ที่ออกแบบมาเพื่อ data transformation หรือการแปลงข้อมูล ช่วยให้การทำงานกับ data ง่ายขึ้น เมื่อเทียบกับ built-in functions

    Use case ของ dplyr เช่น:

    • สำรวจข้อมูล (data exploration)
    • ทำความสะอาดข้อมูล (data cleaning)
    • วิเคราะห์ข้อมูล (data analysis)

    .

    ในบทความนี้ เราจะไปทำความรู้จักกับ 5 functions พื้นฐานของ dplyr ที่ใช้ทำงานกับข้อมูลกัน ซึ่งได้แก่:

    1. select()
    2. filter()
    3. arrange()
    4. summarise() หรือ summarize() (เขียนได้ทั้งสองแบบ)
    5. mutate()

    🧑‍💼 ตัวอย่างข้อมูล HR

    ในบทความนี้ เราจะใช้ชุดข้อมูลจำลอง hr_data เพื่อช่วยอธิบายการใช้งาน 5 functions ของ dplyr

    hr_data ช่วยจำลองสถานการณ์ของ HR ที่ต้องวิเคราะห์ข้อมูลพนักงาน เพื่อหาวิธีแก้ปัญหาพนักงานลาออก (attrition)

    โดย hr_data ประกอบด้วย 8 ตัวแปร:

    No.ColumnData
    1IDรหัสพนักงาน
    2Nameชื่อพนักงาน
    3Departmentแผนก
    4Ageอายุ
    5Engagementคะแนนการมีส่วนร่วม (1 ถึง 100)
    6YearsAtCompanyอายุงาน
    7AttritionRiskความเสี่ยงที่จะลาออก (Low, Medium, High)
    8Salaryเงินเดือน

    Code ในการสร้างและเรียกดู hr_data:

    # Create the dataset
    hr_data <- data.frame(
      ID = 1:15,
      Name = c("Alice", "Bob", "Carol", "David", "Eve", "Frank", "Grace", 
               "Henry", "Ivy", "Jack", "Karen", "Liam", "Mona", "Nate", "Olivia"),
      Department = c("HR", "IT", "Finance", "HR", "Sales", "IT", "Finance", 
                     "Sales", "IT", "HR", "Finance", "Sales", "IT", "HR", "Sales"),
      Age = c(34, 29, 45, 50, 27, 30, 42, 35, 31, 40, 38, 28, 33, 55, 26),
      Engagement = c(85, 70, 65, 55, 90, 75, 60, 88, 80, 50, 68, 72, 78, 40, 95),
      YearsAtCompany = c(5, 2, 15, 25, 1, 3, 10, 7, 4, 20, 12, 1, 6, 30, 0),
      AttritionRisk = c("Low", "Medium", "High", "High", "Low", "Medium", "High", 
                        "Low", "Medium", "High", "High", "Low", "Medium", "High", "Low"),
      Salary = c(55000, 60000, 70000, 75000, 50000, 62000, 68000, 58000, 
                 61000, 77000, 72000, 51000, 64000, 80000, 49000)
    )
    
    # View the dataset
    hr_data
    

    ผลลัพธ์:


    ✍️ Pattern การเขียน Function

    แม้ว่าทั้ง 5 functions จะมีหน้าที่แตกต่างกัน แต่มีการเรียกใช้งานที่เหมือนกัน:

    func(dataset,
         condition)
    • func = ชื่อ function เช่น select, filter, arrange
    • dataset = ชุดข้อมูลที่เป็น input
    • condition = เงื่อนไขในการใช้งานทำงานของ function

    1️⃣ Function #1: select()

    select() ใช้เลือก column ข้อมูลที่ต้องการ

    ตัวอย่าง:

    ผู้บริหารต้องการข้อมูลที่มีแค่รายชื่อพนักงาน แผนก และคะแนนการมีส่วนร่วม

    เราสามารถใช้ select() เลือกเฉพาะ column ที่ต้องการได้:

    # Select only desired columns
    select(hr_data,
           Name,
           Department,
           Engagement)
    

    ผลลัพธ์:

    .

    Note:

    เวลาเลือก column ด้วย select() เราสามารถกำหนดลำดับของ column ที่จะมาแสดงได้ เช่น ต้องการแสดง Department ก่อน Name ก็ให้เขียน Department, Name

    .

    dplyr มี helper function ที่ช่วยในการเลือก column ให้ง่ายขึ้น เช่น:

    FunctionMeaning
    starts_with()เลือก column ที่เริ่มด้วย x
    ends_with()เลือก column ที่ลงท้ายด้วย x
    contains()เลือก column ที่มีคำว่า x
    matches()เลือก column ที่ตรงกับ regular expression
    last_col()เลือก column สุดท้ายในชุดข้อมูล
    ~เลือกทุก column ยกเว้น column ที่ระบุ

    .

    เราสามารถตั้งชื่อ column ใหม่ได้ ด้วยใช้ = เช่น FullName = Name เพื่อให้หัว column แสดงคำว่า Fullname แทน Name


    2️⃣ Function #2: filter()

    filter() ใช้เลือก row ที่ตรงกับเงื่อนไขที่กำหนดมาแสดง

    ตัวอย่าง:

    ผู้บริหารต้องการข้อมูลพนักงานที่ความเสี่ยงที่จะลาออกสูง

    เราสามารถใช้ filter() เพื่อกำหนดเงื่อนไขเพื่อกรองข้อมูลออกมาได้:

    # Filter for high attrition risk
    filter(hr_data,
           AttritionRisk == "High")
    

    ผลลัพธ์:

    .

    Note:

    เราสามารถใช้ boolean operator และ comparison operator ร่วมได้:

    OperatorMeaning
    ==เท่ากับ
    !=ไม่เท่ากับ
    >มากกว่า
    <น้อยกว่า
    &and
    |or
    !not

    เช่น:

    ผู้บริหารต้องการข้อมูลพนักงานที่ความเสี่ยงที่จะลาออกสูง ในแผนกการเงิน (Finance)

    # Filter for high attrition risk in Finance
    filter(hr_data,
           AttritionRisk == "High" & Department == "Finance")
    

    ผลลัพธ์:


    3️⃣ Function #3: arrange()

    arrange() ใช้เรียงข้อมูลตามเงื่อนไข

    ตัวอย่าง:

    ผู้บริหารอยากได้ข้อมูลพนักงานเรียงจากคะแนนการมีส่วนร่วม

    เราสามารถใช้ arrange() จัดลำดับตาม column ที่ต้องการได้:

    # Sort employees by engagement
    arrange(hr_data,
            Engagement)
    

    ผลลัพธ์:

    .

    Note:

    Default ของ arrange() เป็นเรียงจากน้อยไปมาก (A-Z)

    ถ้าต้องการเรียงจากน้อยไปมาก (Z-A) ให้ใช้ desc() เช่น:

    # Sort employees by engagement, from high to low
    arrange(hr_data,
            desc(Engagement))
    

    ผลลัพธ์:


    4️⃣ Function #4: summarise()

    summarise() ใช้ย่อยข้อมูลให้น้อยลง ช่วยให้เข้าใจข้อมูลได้ง่ายขึ้น

    ตัวอย่าง:

    ผู้บริการต้องการรู้ค่าเฉลี่ยคะแนนการมีส่วนร่วม

    เราสามารถใช้ summarise() เพื่อหาค่าเฉลี่ยได้:

    # Calculate mean engagement
    summarise(hr_data,
              mean(Engagement))
    

    ผลลัพธ์:

    .

    Note:

    Functions ที่มักใช้กับ summarise() ได้แก่:

    FunctionMeaning
    mean()หาค่าเฉลี่ย
    min()หาค่าต่ำสุด
    max()หาค่าสูงสุด
    sd()หาค่าเบี่ยงเบนมาตรฐาน (standard deviation)
    n()นับจำนวนข้อมูล

    .

    summarise() มักใช้กับ group_by() เพื่อหาค่าสถิติตามกลุ่มข้อมูล เช่น หาค่าเฉลี่ยคะแนนการทำงานตามระดับความเสี่ยงในการลาออก:

    # Calculate mean engagement by attrition risk
    summarise(group_by(hr_data, AttritionRisk),
              mean(Engagement))
    

    ผลลัพธ์:

    .

    นอกจากนี้ เราสามารถตั้งชื่อ column ของค่าสถิติได้โดยใช้ = ได้ เช่น:

    # Naming the output
    summarise(group_by(hr_data, AttritionRisk),
              AvgEng = mean(Engagement))
    

    ผลลัพธ์:


    5️⃣ Function #5: mutate()

    mutate() ใช้สำหรับสร้างข้อมูลใหม่จากข้อมูลที่มีอยู่แล้ว

    ตัวอย่าง:

    ผู้บริหารอยากรู้ว่า พนักงานแต่ละคนเหลือเวลาก่อนเกษียณอายุเท่าไร

    เราสามารถใช้ mutate() เพื่อสร้าง column ใหม่ที่แสดงจำนวนปีก่อนเกษียณได้:

    # Add a new column
    mutate(hr_data,
           YearsUntilRetirement = 60 - Age)
    

    ผลลัพธ์:

    จากผลลัพธ์ จะเห็นได้ว่า column ใหม่จะต่อท้ายสุด (ด้านขวาสุด)

    .

    Note:

    ถ้าต้องการเห็นแค่ข้อมูลใหม่ เราสามารถเปลี่ยน mutate() เป็น transmute() ได้

    โดยหลังจากได้ข้อมูลใหม่แล้ว transmute() จะทิ้งข้อมูลตั้งต้น และเก็บเฉพาะข้อมูลใหม่ไว้


    🫂 Put Everything Together: Pipe Operator

    เราจะเห็นความสามารถที่แท้จริงของ dplyr ได้เมื่อใช้งานทั้ง 5 functions ร่วมกัน โดยใช้ pipe operator: %>% หรือ |>

    Pipe operator เป็นสิ่งที่ช่วยส่ง output จาก function หนึ่งไปเป็น input ของ function ต่อไป

    เช่น จาก code หาค่าเฉลี่ยคะแนนการทำงานตามระดับความเสี่ยงในการลาออก ก่อนหน้านี้:

    # Calculate mean engagement by attrition risk
    summarise(group_by(hr_data, AttritionRisk),
              AvgEng = mean(Engagement))
    

    ถ้าใช้ pipe operator แล้ว จะเขียนได้แบบนี้:

    # Calculate mean engagement by attrition risk
    hr_data |>
      
      # Group by AttritionRisk
      group_by(AttritionRisk) |>
      
      # Calculate mean
      summarise(AvgEng = mean(Engagement))
    

    ซึ่ง code ทั้งสองชุดให้ผลลัพธ์ที่เหมือนกัน:

    แต่จะเห็นได้ว่า code ที่ใช้ pipe operator มีความชัดเจนและอ่านง่ายกว่า เพราะไม่จำเป็นต้องเขียน code ที่ซ้อนกันเป็นชั้น ๆ

    .

    ทีนี้ ถ้าเราใช้ pipe operator เพื่อรวมทั้ง 5 functions เข้าด้วยกันแล้ว จะทำให้เราใช้ข้อมูลเพื่อตอบคำถามที่ซับซ้อนขึ้นได้

    ตัวอย่าง:

    ผู้บริหารอยากได้รายชื่อพนักงานในกลุ่มเสี่ยงลาออกสูง โดยเรียงตามอายุงานและเงินเดือน จากมากไปน้อย

    เราสามารถใช้ pipe operator ร่วมกัน group_by() + summarise() + arrange() เพื่อตอบโจทย์ได้:

    # Find employees with high attrition risk
    # and sort by tenure and salary
    hr_data |>
      
      # Filter for high attrition risk
      filter(AttritionRisk == "High") |>
      
      # Sort descending by tenure and salary
      arrange(desc(YearsAtCompany),
              desc(Salary))
    

    ผลลัพธ์:

    .

    หรือ

    ผู้บริหารต้องการรู้ว่า จำนวนพนักงานและค่าเฉลี่ยคะแนนการมีส่วนร่วมของแต่ละแผนก โดยเรียงแผนกจากค่าเฉลี่ยมากไปน้อย

    hr_data |> 
      
      # Group by department
      group_by(Department) |>
      
      # Calculate mean and count the number of employees
      summarise(AvgEng = mean(Engagement),
                EmpCount = n()) |>
      
      # Sort descending by average engagement
      arrange(desc(AvgEng))
    

    ผลลัพธ์:

    .

    หรือ

    ผู้บริหารต้องการรู้สัดส่วนพนักงานในกลุ่มความเสี่ยงสูงในแต่ละแผนก โดยเรียงจากมากไปน้อย และขอให้เรียงข้อมูลดังนี้: แผนก สัดส่วนเสี่ยงสูง จำนวนพนักงานทั้งหมด จำนวนพนักงานในกลุ่มเสี่ยงสูง

    hr_data |>
      
      # Group by department
      group_by(Department) |>
      
      # Count high attrition risk and find attrition risk ratio
      summarise(HighRiskCount = sum(AttritionRisk == "High"),
                TotalEmp = n(),
                HighRiskRatio = (HighRiskCount / TotalEmp) * 100) |>
      
      # Select desired columns
      select(Department, HighRiskRatio, TotalEmp, HighRiskCount) |>
      
      # Sort descending by high rish ratio
      arrange(desc(HighRiskRatio))
    

    ผลลัพธ์:


    🔥 สรุป 5 Functions จาก dplyr

    5 functions พื้นฐาน ของ dplyr เป็น functions ที่สามารถใช้ร่วมกันเพื่อทำงานกับข้อมูลต่าง ๆ เช่น ข้อมูลพนักงาน ได้อย่างมีประสิทธิภาพ

    No.FunctionExplain
    1select()เลือก column ที่ต้องการ
    2filter()เลือก row ที่ต้องการ
    3arrange()จัดลำดับข้อมูล
    4sumamrise()สรุปข้อมูล
    5mutate()แปลงข้อมูล

    Note: ใช้ %>% หรือ |> เพื่อเชื่อม functions เข้าด้วยกัน


    💪 Try It Yourself

    สำหรับใครที่อยากลองเล่นใช้ R เล่นกับข้อมูล HR สามารถดาวน์โหลด code ตัวอย่างในบทความได้ที่ GitHub


    📚 อ่านเพิ่มเติมเกี่ยวกับ dplyr


    ✅ R Book for Psychologists: หนังสือภาษา R สำหรับนักจิตวิทยา

    📕 ขอฝากหนังสือเล่มแรกในชีวิตด้วยนะครับ 😆

    🙋 ใครที่กำลังเรียนจิตวิทยาหรือทำงานสายจิตวิทยา และเบื่อที่ต้องใช้ software ราคาแพงอย่าง SPSS และ Excel เพื่อทำข้อมูล

    💪 ผมขอแนะนำ R Book for Psychologists หนังสือสอนใช้ภาษา R เพื่อการวิเคราะห์ข้อมูลทางจิตวิทยา ที่เขียนมาเพื่อนักจิตวิทยาที่ไม่เคยมีประสบการณ์เขียน code มาก่อน

    ในหนังสือ เราจะปูพื้นฐานภาษา R และพาไปดูวิธีวิเคราะห์สถิติที่ใช้บ่อยกัน เช่น:

    • Correlation
    • t-tests
    • ANOVA
    • Reliability
    • Factor analysis

    🚀 เมื่ออ่านและทำตามตัวอย่างใน R Book for Psychologists ทุกคนจะไม่ต้องพึง SPSS และ Excel ในการทำงานอีกต่อไป และสามารถวิเคราะห์ข้อมูลด้วยตัวเองได้ด้วยความมั่นใจ

    แล้วทุกคนจะแปลกใจว่า ทำไมภาษา R ง่ายขนาดนี้ 🙂‍↕️

    👉 สนใจดูรายละเอียดหนังสือได้ที่ meb: