ในบทความนี้ เราจะไปทำความรู้จักกับ eXtreme Gradient Boosting (XGBoost) และวิธีสร้าง XGBoost model ในภาษา R ด้วย xgboost package กัน
ถ้าพร้อมแล้ว ไปเริ่มกันเลย
- 🚀 XGBoost คืออะไร?
- 💻 XGBoost ในภาษา R
- 1️⃣ Install & Load the Package
- 2️⃣ Load & Prepare the Data
- 3️⃣ Split the Data
- 4️⃣ Train the Model
- 5️⃣ Evaluate the Model
- 💪 Summary
- 😺 GitHub
- 📃 References
- ✅ R Book for Psychologists: หนังสือภาษา R สำหรับนักจิตวิทยา
อ่านเกี่ยวกับการปลูกต้นไม้ในภาษา R ภาคก่อน ๆ ได้ที่:
🚀 XGBoost คืออะไร?
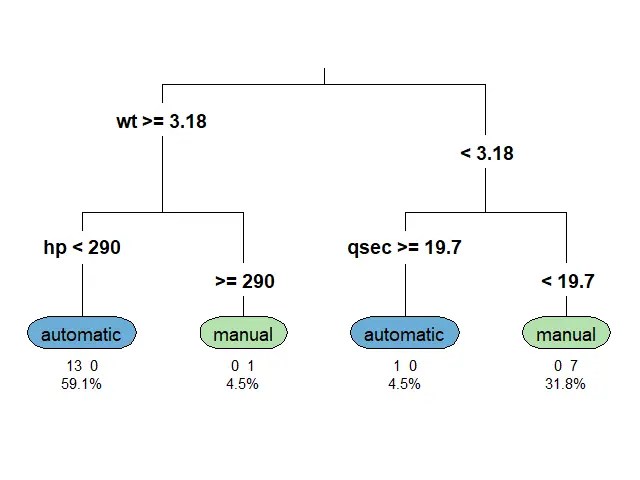
XGBoost เป็น machine learning model ที่จัดอยู่ในกลุ่ม tree-based models หรือ models ที่ทำนายข้อมูลด้วย decision tree อย่าง single decision tree และ random forest
ใน XGBoost, decision trees จะถูกสร้างขึ้นมาเป็นรอบ ๆ โดยในแต่ละรอบ decision trees ใหม่จะเรียนรู้จากความผิดพลาดของรอบก่อน ซึ่งจะทำให้ decision trees ใหม่มีความสามารถที่ดีขึ้นเรื่อย ๆ
เมื่อสิ้นสุดการสร้าง XGBoost ใช้ผลรวมของ decision trees ทุกต้นในการทำนายข้อมูล ดังนี้:
- Regression problem: หาค่าเฉลี่ยแบบถ่วงน้ำหนักจากทุกต้น
- Classification problem: ทำนายผลลัพธ์ด้วยค่าเฉลี่ยความน่าจะเป็นจากทุกต้น
💻 XGBoost ในภาษา R
ในภาษา R เราสามารถสร้าง XGBoost ได้ด้วย xgboost package ใน 5 ขั้นตอน ได้แก่:
- Install and load the package
- Load and prepare the data
- Split the data
- Train the model
- Evaluate the model
1️⃣ Install & Load the Package
ในขั้นแรก ให้เราติดตั้งและเรียกใช้งาน xgboost package
ติดตั้ง:
# Install
install.packages("xgboost")
เรียกใช้งาน:
# Load
library(xgboost)
2️⃣ Load & Prepare the Data
ในขั้นตอนที่สอง ให้เราโหลดและเตรียมข้อมูลที่จะใช้สร้าง XGBoost model โดยในบทความนี้ เราจะใช้ mpg dataset จาก ggplot2 package กัน
mpg ประกอบด้วยข้อมูลรถและระดับการใช้น้ำมัน และจุดประสงค์ของเรา คือ ทำนายระดับการกินน้ำมันเมื่อรถวิ่งบน highway (hwy)
เราสามารถโหลด mpg ได้ผ่าน ggplot2:
# Install ggplot2
install.packages("ggplot2")

# Load ggplot2
library(ggplot2)

# Load the dataset
data(mpg)
เมื่อโหลด dataset แล้ว เราสามารถสำรวจข้อมูลได้ด้วย head():
# Preview
head(mpg)
ผลลัพธ์:
# A tibble: 6 × 11
  manufacturer model displ  year   cyl trans      drv     cty   hwy fl    class
  <chr>        <chr> <dbl> <int> <int> <chr>      <chr> <int> <int> <chr> <chr>
1 audi         a4      1.8  1999     4 auto(l5)   f        18    29 p     compact
2 audi         a4      1.8  1999     4 manual(m5) f        21    29 p     compact
3 audi         a4      2    2008     4 manual(m6) f        20    31 p     compact
4 audi         a4      2    2008     4 auto(av)   f        21    30 p     compact
5 audi         a4      2.8  1999     6 auto(l5)   f        16    26 p     compact
6 audi         a4      2.8  1999     6 manual(m5) f        18    26 p     compact
และดูโครงสร้างข้อมูลด้วย str():
# View the tructure
str(mpg)
ผลลัพธ์:
tibble [234 × 11] (S3: tbl_df/tbl/data.frame)
 $ manufacturer: chr [1:234] "audi" "audi" "audi" "audi" ...
 $ model       : chr [1:234] "a4" "a4" "a4" "a4" ...
 $ displ       : num [1:234] 1.8 1.8 2 2 2.8 2.8 3.1 1.8 1.8 2 ...
 $ year        : int [1:234] 1999 1999 2008 2008 1999 1999 2008 1999 1999 2008 ...
 $ cyl         : int [1:234] 4 4 4 4 6 6 6 4 4 4 ...
 $ trans       : chr [1:234] "auto(l5)" "manual(m5)" "manual(m6)" "auto(av)" ...
 $ drv         : chr [1:234] "f" "f" "f" "f" ...
 $ cty         : int [1:234] 18 21 20 21 16 18 18 18 16 20 ...
 $ hwy         : int [1:234] 29 29 31 30 26 26 27 26 25 28 ...
 $ fl          : chr [1:234] "p" "p" "p" "p" ...
 $ class       : chr [1:234] "compact" "compact" "compact" "compact" ...
จากผลลัพธ์ เราจะเห็นได้ว่า mpg มี columns ที่เราต้องปรับจาก character เป็น factor อยู่ เช่น manufacturer, model ซึ่งเราสามารถปรับได้ดังนี้:
# Convert character columns to factor

## Get character columns
chr_cols <- c("manufacturer",
              "model",
              "trans",
              "drv",
              "fl",
              "class")

## For-loop through the character columns
for (col in chr_cols) {
  mpg[[col]] <- as.factor(mpg[[col]])
}

## Check the results
str(mpg)
ผลลัพธ์:
tibble [234 × 11] (S3: tbl_df/tbl/data.frame)
 $ manufacturer: Factor w/ 15 levels "audi","chevrolet",..: 1 1 1 1 1 1 1 1 1 1 ...
 $ model       : Factor w/ 38 levels "4runner 4wd",..: 2 2 2 2 2 2 2 3 3 3 ...
 $ displ       : num [1:234] 1.8 1.8 2 2 2.8 2.8 3.1 1.8 1.8 2 ...
 $ year        : int [1:234] 1999 1999 2008 2008 1999 1999 2008 1999 1999 2008 ...
 $ cyl         : int [1:234] 4 4 4 4 6 6 6 4 4 4 ...
 $ trans       : Factor w/ 10 levels "auto(av)","auto(l3)",..: 4 9 10 1 4 9 1 9 4 10 ...
 $ drv         : Factor w/ 3 levels "4","f","r": 2 2 2 2 2 2 2 1 1 1 ...
 $ cty         : int [1:234] 18 21 20 21 16 18 18 18 16 20 ...
 $ hwy         : int [1:234] 29 29 31 30 26 26 27 26 25 28 ...
 $ fl          : Factor w/ 5 levels "c","d","e","p",..: 4 4 4 4 4 4 4 4 4 4 ...
 $ class       : Factor w/ 7 levels "2seater","compact",..: 2 2 2 2 2 2 2 2 2 2 ...
ตอนนี้ columns ที่เราต้องการถูกเปลี่ยนเป็น factor เรียบร้อยแล้ว
3️⃣ Split the Data
ในขั้นที่สาม เราจะทำ 3 อย่างด้วยกัน คือ:
- แยกตัวแปรต้น (x) และตัวแปรตาม (y) ออกจากกัน
- แบ่งข้อมูลออกเป็น training และ test sets
- แปลงข้อมูลให้เป็น
DMatrix
ข้อที่ 1. เราสามารถแยกตัวแปรต้นและตัวแปรตามออกจากกันได้ดังนี้:
# Separate the features from the outcome

## Get the features
x <- mpg[, !names(mpg) %in% "hwy"]

## One-hot encode the features
x <- model.matrix(~ . - 1,
                  data = x)

## Get the outcome
y <- mpg$hwy
สังเกตว่า ตอนที่เราแยกตัวแปรต้น เราแปลงตัวแปรเหล่านี้เป็น 0, 1 ด้วย one-hot encoding ด้วย เนื่องจาก xgboost ต้องการตัวแปรต้นที่เป็น numeric
.
ข้อที่ 2. จากนั้น เราจะแบ่ง dataset เป็น training (80%) และ test sets (20%) ดังนี้:
# Split the data

## Set seed for reproducibility
set.seed(360)

## Get training index
train_index <- sample(1:nrow(x),
                      nrow(x) * 0.8)

## Create x, y train
x_train <- x[train_index, ]
y_train <- y[train_index]

## Create x, y test
x_test <- x[-train_index, ]
y_test <- y[-train_index]

## Check the results
cat("TRAIN SET", "\\n")
cat("1. Data in x_train:", nrow(x_train), "\\n")
cat("2. Data in y_train:", length(y_train), "\\n")
cat("---", "\\n", "TEST SET", "\\n")
cat("1. Data in x_test:", nrow(x_test), "\\n")
cat("2. Data in y_test:", length(y_test), "\\n")
ผลลัพธ์:
TRAIN SET
1. Data in x_train: 187
2. Data in y_train: 187
---
TEST SET
1. Data in x_test: 47
2. Data in y_test: 47
.
ข้อที่ 3. สุดท้าย เราจะแปลง x, y เป็น DMatrix ซึ่งเป็น object ที่ xgboost ใช้ในการสร้าง XGboost model ดังนี้:
# Convert to DMatrix

## Training set
train_set <- xgb.DMatrix(data = x_train,
                         label = y_train)

## Test set
test_set <- xgb.DMatrix(data = x_test,
                        label = y_test)

## Check the results
train_set
test_set
ผลลัพธ์:
TRAIN SET
xgb.DMatrix  dim: 187 x 77  info: label  colnames: yes
---
TEST SET
xgb.DMatrix  dim: 47 x 77  info: label  colnames: yes
4️⃣ Train the Model
ในขั้นที่สี่ เราจะสร้าง XGBoost model ด้วย xgb.train() ซึ่งต้องการ 5 arguments ดังนี้:
xgb.train(params, data, nrounds, watchlist, verbose)params= hyperparametre ที่ต้องการใช้สร้าง model ที่ดีที่สุดdata= training set ที่ใช้สร้าง modelnrounds= จำนวนครั้งในการในสร้าง decision treeswatchlist= ชุดข้อมูลที่ต้องการใช้ประเมินความสามารถของ modelverbose= พิมพ์ข้อมูลในระหว่างการสร้าง model (1) หรือไม่ (0)
(Note: ศึกษา argument อื่น ๆ ของ xgb.train() ได้ที่ XGBoost Parameters)
สำหรับบทความนี้ เราจะใช้ xgb.train() ดังนี้:
# Train the model

## Set hyperparametres
hp <- list(objective = "reg:squarederror",
           eta = 0.1,
           max_depth = 4,
           eval_metric = c("rmse",
                           "mae"))

## Train
xgb_model <- xgb.train(params = hp,
                       data = train_set,
                       nrounds = 50,
                       watchlist = list(train = train_set,
                                        test = test_set),
                       verbose = 1)
ผลลัพธ์:
[1]	train-rmse:21.083975	test-rmse:22.739357
[2]	train-rmse:19.045063	test-rmse:20.598582
[3]	train-rmse:17.204130	test-rmse:18.713079
[4]	train-rmse:15.549113	test-rmse:16.974701
[5]	train-rmse:14.053049	test-rmse:15.453560
[6]	train-rmse:12.707307	test-rmse:14.097377
[7]	train-rmse:11.495216	test-rmse:12.877722
[8]	train-rmse:10.402476	test-rmse:11.767320
[9]	train-rmse:9.413522	test-rmse:10.740546
[10]	train-rmse:8.525230	test-rmse:9.863130
[11]	train-rmse:7.722776	test-rmse:9.068840
[12]	train-rmse:7.000648	test-rmse:8.357181
[13]	train-rmse:6.346603	test-rmse:7.687483
[14]	train-rmse:5.758685	test-rmse:7.091249
[15]	train-rmse:5.229548	test-rmse:6.557082
[16]	train-rmse:4.753713	test-rmse:6.079389
[17]	train-rmse:4.325653	test-rmse:5.651858
[18]	train-rmse:3.940325	test-rmse:5.275154
[19]	train-rmse:3.594545	test-rmse:4.938849
[20]	train-rmse:3.283961	test-rmse:4.627743
[21]	train-rmse:3.003089	test-rmse:4.352060
[22]	train-rmse:2.747553	test-rmse:4.110172
[23]	train-rmse:2.519617	test-rmse:3.889650
[24]	train-rmse:2.314957	test-rmse:3.691806
[25]	train-rmse:2.133630	test-rmse:3.499208
[26]	train-rmse:1.969083	test-rmse:3.330280
[27]	train-rmse:1.823011	test-rmse:3.181541
[28]	train-rmse:1.693565	test-rmse:3.045308
[29]	train-rmse:1.575817	test-rmse:2.919070
[30]	train-rmse:1.469256	test-rmse:2.812063
[31]	train-rmse:1.375599	test-rmse:2.700515
[32]	train-rmse:1.292928	test-rmse:2.615973
[33]	train-rmse:1.218867	test-rmse:2.541929
[34]	train-rmse:1.151134	test-rmse:2.462113
[35]	train-rmse:1.092395	test-rmse:2.404873
[36]	train-rmse:1.039158	test-rmse:2.336600
[37]	train-rmse:0.993882	test-rmse:2.291398
[38]	train-rmse:0.952062	test-rmse:2.236936
[39]	train-rmse:0.915935	test-rmse:2.198657
[40]	train-rmse:0.879957	test-rmse:2.152984
[41]	train-rmse:0.850423	test-rmse:2.102272
[42]	train-rmse:0.822475	test-rmse:2.054172
[43]	train-rmse:0.799025	test-rmse:2.011621
[44]	train-rmse:0.775398	test-rmse:1.971787
[45]	train-rmse:0.755066	test-rmse:1.933539
[46]	train-rmse:0.736655	test-rmse:1.900084
[47]	train-rmse:0.719087	test-rmse:1.870832
[48]	train-rmse:0.705279	test-rmse:1.853400
[49]	train-rmse:0.691914	test-rmse:1.834918
[50]	train-rmse:0.680016	test-rmse:1.825738
จะเห็นได้ว่า model ในแต่ละรอบมี RMSE หรือตัวบ่งชี้ความคลาดเคลื่อน ที่ลดลงเรื่อย ๆ เนื่องจาก model ใหม่เรียนรู้จากความผิดพลาดของ model ก่อนหน้า
หลังจากสร้าง model เสร็จแล้ว เราสามารถดูรายละเอียดของ model ได้แบบนี้:
# Print the model
xgb_model
ผลลัพธ์:
##### xgb.Booster
raw: 62.4 Kb
call:
  xgb.train(params = hp, data = train_set, nrounds = 50, watchlist = list(train = train_set,
    test = test_set), verbose = 1)
params (as set within xgb.train):
  objective = "reg:squarederror", eta = "0.1", max_depth = "4", eval_metric = "rmse", validate_parameters = "mae", objective = "TRUE"
xgb.attributes:
  niter
callbacks:
  cb.print.evaluation(period = print_every_n)
  cb.evaluation.log()
# of features: 77
niter: 50
nfeatures : 77
evaluation_log:
  iter train_rmse test_rmse
 <num>      <num>     <num>
     1 21.0839746 22.739357
     2 19.0450628 20.598582
   ---        ---       ---
    49  0.6919137  1.834918
    50  0.6800159  1.825738
5️⃣ Evaluate the Model
ในขั้นสุดท้าย เราจะประเมินความสามารถของ model ใน 3 ขั้นตอนกัน คือ:
- ใช้ model ทำนายตัวแปรตาม
- คำนวณ MAE, RMSE, และ R squared
- Print MAE, RMSE, และ R squared
.
ข้อที่ 1. ใช้ model ทำนายตัวแปรตาม ด้วย predict():
# Make predictions
y_pred <- predict(xgb_model,
                  newdata = x_test)

# Compare predictions to actual outcomes
results <- data.frame(actual = y_test,
                      predicted = y_pred,
                      error = y_test - y_pred)

# Preview the results
head(results, 10)
ผลลัพธ์:
   actual predicted      error
1      31  27.81219  3.1878090
2      25  25.89449 -0.8944893
3      30  30.13318 -0.1331844
4      29  26.77814  2.2218552
5      24  24.34723 -0.3472347
6      23  23.58175 -0.5817528
7      19  17.81131  1.1886921
8      12  12.32908 -0.3290768
9      12  12.31534 -0.3153391
10     16  16.25793 -0.2579288
.
ข้อที่ 2. คำนวณ MAE, RMSE, และ R squared ซึ่งเป็นตัวชี้วัดความสามารถของ regression models:
# Calculate MAE
mae <- mean(abs(results$error))

# Calculate RMSE
rmse <- sqrt(mean((results$error)^2))

# Calculate R squared
ss_res <- sum((results$error)^2)
ss_tot <- sum((results$actual - mean(results$actual))^2)
r_squared <- 1 - (ss_res / ss_tot)
.
ข้อที่ 3. แสดงผลลัพธ์:
# Print the results
cat("MAE:", round(mae, 2), "\\n")
cat("RMSE:", round(rmse, 2), "\\n")
cat("R squared:", round(r_squared, 2), "\\n")
ผลลัพธ์:
MAE: 1.23
RMSE: 1.83
R squared: 0.93
จะเห็นได้ว่า model ของเราสามารถอธิบายตัวแปรตามได้ถึง 93% (R squared) และมีความคลาดเคลื่อนโดยเฉลี่ย 1.23 miles per gallon (MAE)
💪 Summary
ในบทความนี้ เราได้ไปทำความรู้จักการสร้าง boosted tree ด้วย xgboost package ในภาษา R ซึ่งมีการทำงาน 5 ขั้นตอนกัน:
- Install and load the package
- Load and prepare the data
- Split the data
- Train the model
- Evaluate the model
😺 GitHub
ดู code ทั้งหมดในบทความนี้ได้ที่ GitHub
📃 References
- Complete Guide to Gradient Boosting and XGBoost in R
- Gradient Boosting คืออะไร
- Tree-based Algorithms แบบ High Level
- A Guide to The Gradient Boosting Algorithm
✅ R Book for Psychologists: หนังสือภาษา R สำหรับนักจิตวิทยา
📕 ขอฝากหนังสือเล่มแรกในชีวิตด้วยนะครับ 😆
🙋 ใครที่กำลังเรียนจิตวิทยาหรือทำงานสายจิตวิทยา และเบื่อที่ต้องใช้ software ราคาแพงอย่าง SPSS และ Excel เพื่อทำข้อมูล
💪 ผมขอแนะนำ R Book for Psychologists หนังสือสอนใช้ภาษา R เพื่อการวิเคราะห์ข้อมูลทางจิตวิทยา ที่เขียนมาเพื่อนักจิตวิทยาที่ไม่เคยมีประสบการณ์เขียน code มาก่อน
ในหนังสือ เราจะปูพื้นฐานภาษา R และพาไปดูวิธีวิเคราะห์สถิติที่ใช้บ่อยกัน เช่น:
- Correlation
- t-tests
- ANOVA
- Reliability
- Factor analysis
🚀 เมื่ออ่านและทำตามตัวอย่างใน R Book for Psychologists ทุกคนจะไม่ต้องพึง SPSS และ Excel ในการทำงานอีกต่อไป และสามารถวิเคราะห์ข้อมูลด้วยตัวเองได้ด้วยความมั่นใจ
แล้วทุกคนจะแปลกใจว่า ทำไมภาษา R ง่ายขนาดนี้ 🙂↕️
👉 สนใจดูรายละเอียดหนังสือได้ที่ meb: